American Values, Democracy, and the 'Strong Leader' Problem
- The Trump phenomenon has exposed an undercurrent in American values that World Values Survey researchers have known well.
Let me start with an anecdote from an uncomfortable experience while I was a graduate student at Alabama presenting a draft of a project (that is now available online at Conflict Management and Peace Science) at a major conference. Another graduate student, at a far more prestigious department than mine, objected that my analysis of territorial threat and support for autocratic governance included World Values Survey observations from the United States when 1) the U.S. has no territorial disputes and 2) the U.S. is the longest continuous democracy in the world and therefore preferences for autocratic rule are not serious. The entire tone of the question was that I was an idiot as determined by someone of equal rank at a more prestigious department. I suppose we’ve all had that conference experience in graduate school.
My response highlighted several points (see footnote), but one is relevant to an ongoing current event and the rest of this article.1 I paraphrase my response to that audience member only slightly; “have you seen American responses to the World Values Survey question on support for a strong leader unencumbered by elections or a legislature?” Almost 30 percent of Americans supported that form of government in 1999, an increase of about five percent from the support for that form of government in the 1995 wave. American attitudes about democracy belie the U.S.’ position as the longest continuous democracy in the Polity data.
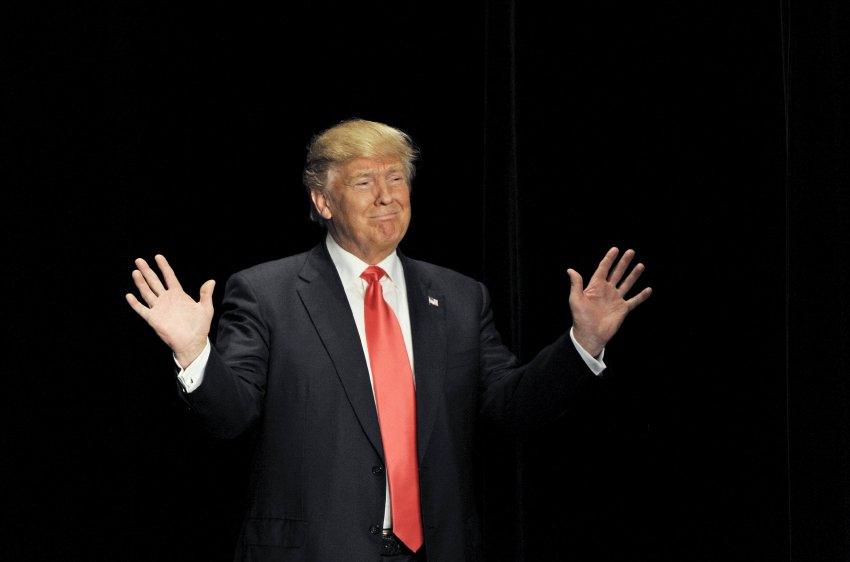
I did not appear to convince that particular audience member at that conference, but more people are seeing the rise of Donald Trump and taking note of what amounts to an open secret in the World Values Survey data. Pippa Norris has talked about it. Jonathan Freedland at The Guardian noticed it as well. Simply, there is a large subset of Americans that may have a fickle attachment to democracy. Trump’s rhetoric and his proposed policies are just attracting voters who have been wanting a candidate to override democratic norms in the pursuit of policies they want. This article from The Onion is probably closer to reality than satire.
I decided to poke around the four waves of World Values Survey data in which this question appears to highlight the particular patterns emerging in American support for a strong leader unhindered by regular elections or legislature. The tl;dr version comes in the last paragraph in this introduction. My analyses follow in the next section.
tl;dr: the U.S. is conspicuous among its democratic peers in its preferences for strong leaders with discretionary authority. These preferences are on the rise. Educational attainment is an important attribute. Better educated Americans are less likely to prefer that kind of head of state. White Americans are actually less likely to prefer this type of executive authority but the effect of lower levels of education on white respondents is stronger than the effect on other racial/ethnic categories. Republicans with no more than a high school education are more likely to prefer that strong leader in the most recent World Values Survey wave. These attitudes in support of a strong leader have important implications for other attitudes about democracy among Americans.
The U.S. Is Conspicuous Among Its Democratic Peers
Pippa Norris noted that this type of authoritarian sentiment is rising in the West. This is true, but the U.S. still stands out among its democratic peers for its receptiveness to this form of government.
Consider the table below, in which I take data from World Values Survey and European Values Survey for all waves from the mid-1990s to the most recent wave that World Values Survey just completed.2 I subset the data to what I think we could consider to be the U.S. democratic peers.3 Both survey data sets contain two questions of interest, the exact text I reproduce below.
I’m going to describe various types of political systems and ask what you think about each as a way of governing this country. For each one, would you say it is a very good, fairly good, fairly bad or very bad way of governing this country?
- (e114) Having a strong leader who does not have to bother with parliament and elections
- (e117) Having a democratic political system
The respondent can choose “very good”, “fairly good”, “fairly bad”, or “very bad”. I make four binary variables from this that code 1 if the respondent 1) thinks a strong leader is either “very good” or “fairly good”, 2) thinks a strong leader is “very good”, 3) thinks having a democratic political system is “very bad” or “fairly bad”, and 4) thinks having a democratic political system is “very bad”.
For each of the U.S. democratic peers, I aggregate the percent of ones in a given country-year and then locate the median in a given wave. Table 1 shows the median percent of 1s for each of these four variables across four waves of values data and compares it with the aggregate response from the United States in its survey.
The data show the U.S. is conspicuous for ranking above the median in all but one instance (those who think a strong leader is “very good” in the third wave). The distance between the United States and the median of its democratic peers seems to be rising in each successive wave as well.
| Strong Leader is Good |
Strong Leader is Very Good |
Having Democracy is Bad |
Having Democracy is Very Bad |
|
|---|---|---|---|---|
| Third Wave Median (1995-98) | 18.64% | 5.81% | 7.37% | 1.61% |
| United States (1995) | 22.81% | 2.86% | 9.08% | 2.78% |
| Fourth Wave Median (1999-2000) | 20.65% | 4.99% | 6.92% | 1.48% |
| United States (1999) | 29.28% | 8.21% | 11.27% | 4.28% |
| Fifth Wave Median (2006-2009) | 21.64% | 4.89% | 7.70% | 1.50% |
| United States (2006) | 32.24% | 6.68% | 12.69% | 3.17% |
| Sixth Wave Median (2011-2013) | 23.67% | 4.75% | 5.82% | 1.70% |
| United States (2011) | 31.61% | 5.93% | 16.45% | 4.96% |
I’ll leave it to the reader to make inferences about what this says about American attitudes toward democracy, but do note some jarring statistics in this table. Over 30% of Americans think having a head of state unencumbered by elections or Congress is a good thing. Further, opposition to having a democratic political system in the United States has risen over 80% from 1995 to 2011. Over 16% of Americans in the most recent World Values Survey data think having a democratic political system is bad for the United States.
Support for Strong Leaders is on the Rise
Commentary about America’s emerging “strong leader” problem in the World Values Survey data typically stops with an observation about the aggregate response to this survey question. There is some substantial heterogeneity in attitudes toward a strong leader without elections or a legislature in the United States that are worth exploring.
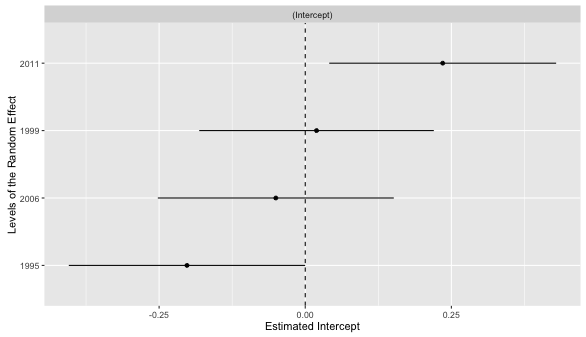
- The random effect for year.
I estimated a mixed effects model that regresses the binary good/bad strong leader variable on a series of random effects for census regions, year (1995, 1999, 2006, 2011), race/ethnic category (white, black, Hispanic, other [i.e. Asian or Middle East ancestry], and mixed race), education categories (did not finish high school, high school educated, college dropout, college educated) and the unions of census region and year, race/ethnicity and year, and education category and year. I extracted the levels of the random effect and their conditional variances after the model converged.
Importantly, support for strong leaders is on the rise in the United States. The descriptive statistics showed that above. The mixed effects model suggests it as well. The intercept and conditional variance for 2011 is discernible from zero in the mixed effects model I estimated.
Pippa Norris showed that authoritarian political parties are on the rise in the West. My model suggests mass attitudes in support of politicians like these are on the rise in the United States as well.
The Importance of Education
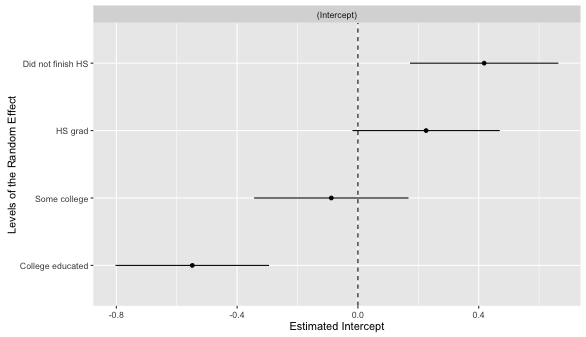
- The random effect for education categories.
The caterpillar plot of the random effect for education category squares with conventional wisdom. Support for a strong leader that does not have to deal with elections or Congress is highest among the least educated Americans.
I should caution that the conditional variance for a random effect does not have the same inferential property as a standard error for a fixed effect, but it does have illustrative value. It suggests that the intercept for responses in the high school education and did not finish high school categories are higher than the global intercept for all responses to this recoded binary strong leaders question. Americans in lower education categories are more receptive to a strong leader without institutional constraints, which squares well with what we know about the Trump phenomenon.
A basic crosstab will give the same descriptive finding.
| Strong Leader | Did Not Finish HS |
HS Grad | Some College | College Grad |
|---|---|---|---|---|
| Good | 38.56% | 32.80% | 27.25% | 18.96% |
| Bad | 61.44% | 67.20% | 72.75% | 81.04% |
The effect of increasing education from failing to finish high school to a college education (or more) decreases preferences for a strong leader by almost 20 percentage points.
There’s no Simple Story to Race…
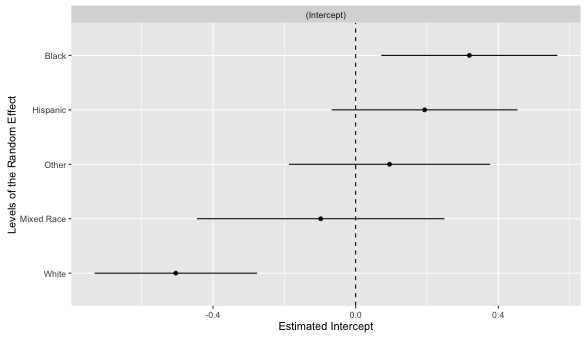
- The random effect for racial/ethnic categories.
The Trump phenomenon is fueled in large part by white voters with a fear and antipathy of the “other” (i.e. Mexicans against whom Trump proposes swift deportation and a wall and Muslims who Trump believes should be barred entry into the country). However, it would be a mistake to assume that support for a strong leader in the World Values Survey data falls largely on white respondents.
In fact, white respondents are the least likely to support the kind of leader that Trump purports to be, all things equal. Observe the intercepts and conditional variances for categories of the random effect. The intercept and conditional variance for white respondents is discernibly below zero while the intercept and conditional variance for black respondents is above zero.
The cross-tab below supports a similar interpretation. The percent of repsonses among white Americans favoring this kind of executive authority is about 10 percentage points below mixed race or Asian/Middle Eastern respondents and about 20 percentage points below black and Hispanic Americans.
| Strong Leader | Black | Hispanic | Mixed Race | Other | White |
|---|---|---|---|---|---|
| Good | 46.36% | 46.40% | 35.95% | 35.52% | 24.90% |
| Bad | 53.64% | 53.60% | 64.05% | 64.48% | 75.10% |
…but There is that Low Educated-Whites Effect
Donald Trump has talked about how he loves the poorly educated because they comprise a big part of his support base. His voters (to this point) are almost entirely working-class whites. It is not surprising that there is that confluence of low-educated white Americans who think a leader like Trump proposes to be is good for America.
I’ll show this with a fixed effect for education that codes a 1 if the American in the sample has a high school education or less. This drops the education category as a random effect from the model. Thereafter, I estimate the same mixed effects model with just one fixed effect for a high school education or less and allow the fixed effect to vary by racial/ethnic group.
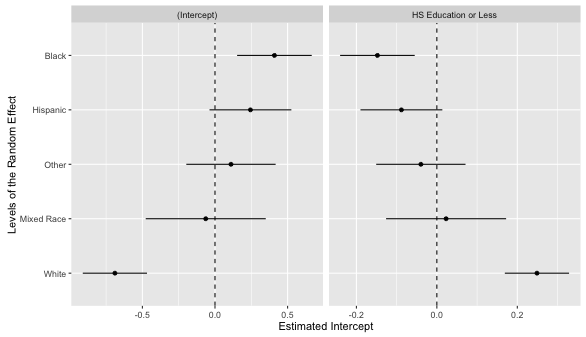
- The random effect for racial/ethnic categories.
The results show that the fixed effect for a high school education or less is statistically significant at the .05 level. The coefficient suggests that the effect of having just a high school diploma or less increases the natural logged odds of thinking that a strong leader without elections or Congress is good for America by .516. I omit a regression table here, though the code on my Github will reproduce this result.
The conditional variance for the random intercept for racial/ethnic category and the random slope for the high school education or less variable suggest what we think is intuitive for the Trump phenomenon right now. White Americans may have lower levels of support for a President that can rule by discretion without interference from Congress or elections relative to other racial/ethnic categories. However, the effect of lower levels of education on support for strong leaders is positive and stronger among white Americans than Americans from other races.
What Explains Preferences for a Strong Leader?
The previous analyses used random effects as basis for exploratory data analysis. The next analysis shows individual-level demographic factors and political attitudes that are statistically associated with preferences for a strong leader. The choice of individual-level predictors mirrors my research design for a similar project that is currently a revise-and-resubmit invitation with some flexibility for the peculiar case of the United States.
| Model 1 | Model 2 | |
| Age | -0.478*** | -0.727*** |
| (0.073) | (0.137) | |
| Age^2 | 0.187 | 0.238 |
| (0.133) | (0.249) | |
| Female | 0.105 | 0.317** |
| (0.071) | (0.136) | |
| High School Education or Less | 0.419*** | 0.397** |
| (0.100) | (0.182) | |
| Ideology | 0.101 | 0.400** |
| (0.081) | (0.169) | |
| Ideology^2 | -0.437*** | -1.006*** |
| (0.102) | (0.217) | |
| Income Scale | 0.063 | 0.236* |
| (0.074) | (0.143) | |
| Republican | -0.525*** | -1.058*** |
| (0.133) | (0.222) | |
| Unemployed | 0.518*** | 0.274 |
| (0.146) | (0.265) | |
| Autonomy Values | -0.060 | -0.001 |
| (0.072) | (0.140) | |
| Choice Values | -0.400*** | -0.282* |
| (0.079) | (0.158) | |
| Equality Values | -0.436*** | -0.419*** |
| (0.075) | (0.140) | |
| Voice Values | -0.089 | -0.289** |
| (0.073) | (0.146) | |
| Republican*HS Ed. or Less | 0.221 | 0.593** |
| (0.153) | (0.278) | |
| Years | 1995-2011 | 2011 |
| N | 4483 | 1308 |
| ***p < .01; **p < .05; *p < .1 | ||
The R code available on my Github will show how I code each of these independent variables, though I will describe them here. Age is simply the age of the respondent in years. I include a square term of age to see if there is a curvilinear effect of age (i.e. the youngest and the most elderly respondents are more similar to each other than respondents in the middle of the distribution of age). I also include a dummy variable for female respondents.
I also code whether a respondent is unemployed, the income level of the respondent, and whether the respondent has a high school education or less. All three things tend to travel together, though not in a way that would suggest a collinearity problem in a statistical model.
I include the always problematic ideology measure as well. In most applications, the ideology question is problematic because it is not asked or not answered in many countries of interest (e.g. China, Israel) for cross-national survey researchers. In the American context, this question is problematic because it imposes a unidimensional left-right 10-point scale on what most American political scientists consider a multidimensional concept. I also square the ideology measure to test for a curvilinear effect.
I also code the respondent as a Republican if s/he says s/he would vote for the Republican party if a national election were held tomorrow. This is not a perfect proxy of party identification in the United States, though it will have to do. I interact the high school education or less variable with the party identification dummy for Republicans to test for an interactive effect among the low-education Republican voters that most believe are driving the support for Trump.
Finally, I include the four “emancipative values” components proposed by Christian Welzel in his 2013 book, Freedom Rising. Welzel argues his index of emancipative values are an improvement on the “traditional values” framework that Inglehart and Baker (2000) studied. Welzel’s emancipative values consists of four components of “autonomy”, “choice”, “equality”, and “voice”, each of which I replicate as a latent trait estimated from a graded response model to minimize the effect of missing data.4
I estimate two mixed effects generalized linear models reported in the table to the right. Model 1 is all survey years from 1995 to 2011 (i.e. four waves) with random effects for census region, year, racial/ethnic group, census region-year, and racial/ethnic group-year. Model 2 is just 2011 with random effects for census region and racial/ethnic group. All non-binary predictors are centered on the survey year and scaled by two standard deviations.
The results suggest interesting heterogeneity in American attitudes toward a strong leader without oversight from regular elections or Congress. Older Americans are less likely than younger Americans to prefer that type of executive authority, though there is no statistically significant effect of the square term. There are some interesting effects of ideology. Americans on the far left and far right are alike in their aversion to that kind of head of state that can rule by discretion though the effect of increasing ideology to the political right makes an American more likely to prefer that kind of head of state in 2011.
Only two of Welzel’s emancipative components are statistically significant across both models. Americans more accepting of abortion, divorce, and homosexuality and Americans more supportive of gender equality in educational opportunities, on the job, and in politics are less likely to prefer a strong leader. Americans who think having a greater voice in politics is a personal and national priority are less likely to prefer a strong head of state in the 2011 wave. The negative effect of the autonomy index cannot be discerned from zero in either model.
The most interesting results concern the constituent terms for high school education or less, preference for the Republican party, and the interaction between them. Generally, Americans with no more than a high school education are more likely to prefer a head of state unencumbered by elections or Congress than those with at least some college education. Republicans are generally against that type of leadership relative to non-Republicans.
I offer those two statements with two caveats. One, this is the correct interpretation without the interactive effect (and it still holds if you were to drop the interaction and re-estimate both models). The correct interpretation for the high school education or less coefficient is for that value of education among respondents who are not Republicans while the correct interpretation for the Republican party coefficient is for those respondents with at least some college education. Two, the comparison category for the Republican is not Democrat; it’s just “not Republican” (i.e. Democrats, independents, and others).5
Do note there is a statistically significant interaction in 2011 for Republicans with a high school education or less. Those respondents are likely to think that a strong head of state that can rule by discretion without regular oversight from elections or Congress is good for the United States. I think we are observing those attitudes driving the Trump vote through the primary season with expectations that a President Trump would impose constitutionally “questionable” policies and overwhelm Congress in the process.
What Else Do Americans Who Want “Strong Leaders” Think?
The previous analyses showed that support for strong leaders without oversight from elections or Congress is conspicuous in the United States relative to the U.S. democratic peers. Support for strong leaders is also on the rise in the United States. I also uncovered some important correlates of support for strong leaders as well. These are important because Americans who want a strong leader for the United States also hold other attitudes about democracy that are less than ideal.
The models below estimate opposition to having a democratic political system (as a binary dependent variable) in addition to various attitudes about democracy. The importance of having a country governed democratically (on a 1-10 scale) is the first of these variables. The remaining dependent variables are attitudes about what could be considered an essential part of democracy on a 1-10 scale. These are:
- People can change the laws in referendums.
- Women have the same rights as men.
- The army takes over when government is incompetent.
- People choose their leaders in free elections.
Higher values mean the respondent believes that particular property of democracy is more “essential” to democracy itself.
The estimation is the same as the analyses reported in the first table, with a few changes to note. I use the four-part ordinal strong leader measure as an independent vriable, center it on the survey wave and scale it by two standard deviations. I drop the interaction between educational attainment and whether the respondent is a Republican. I also use the full emancipative values measure rather than each of the four components that comprise the index. The model that estimates opposition to having a democracy has data from all four waves and thus has year, census region-year, and racial/ethnic group-year random effects. The remaining models have dependent variables asked in just the last two waves and thus has random effects for just census region and racial/ethnic categories. The first model is a generalized linear mixed effects model. The second model is a linear mixed effects model.
The results show a robust association with Americans who want a strong leader for the United States and attitudes about democracy and its features that most onlookers should/would consider antithetical to democracy itself. The table below contains other interesting correlates of these attitudes toward democracy.6
| Opposition to Democracy | Democracy is Important | People Can Change the Laws | Women Have Same Rights as Men | Army Takes Over Incompetent Government | People Choose Leaders in Elections | |
| Model 1 | Model 2 | Model 3 | Model 4 | Model 5 | Model 6 | |
| Strong Leader | 0.499*** | -0.895*** | -1.140*** | -0.959*** | 1.427*** | -1.262*** |
| (0.097) | (0.072) | (0.140) | (0.091) | (0.110) | (0.088) | |
| Age | -0.648*** | 0.877*** | 0.866*** | 0.601*** | -0.563*** | 0.312*** |
| (0.103) | (0.071) | (0.140) | (0.090) | (0.109) | (0.087) | |
| Age^2 | -0.108 | -0.129 | -0.274 | -0.338** | -0.014 | -0.329** |
| (0.193) | (0.129) | (0.253) | (0.162) | (0.197) | (0.156) | |
| Female | 0.373*** | -0.002 | -0.138 | -0.006 | 0.359*** | -0.047 |
| (0.100) | (0.069) | (0.134) | (0.087) | (0.105) | (0.084) | |
| High School Education or Less | 0.657*** | -0.169** | -0.662*** | -0.190** | 0.604*** | -0.432*** |
| (0.120) | (0.073) | (0.231) | (0.093) | (0.112) | (0.090) | |
| Ideology | -0.113 | 0.264*** | 0.259* | -0.055 | 0.079 | 0.234** |
| (0.111) | (0.080) | (0.157) | (0.101) | (0.123) | (0.098) | |
| Ideology^2 | -0.135 | 0.437*** | 0.355* | 0.405*** | -0.388*** | 0.393*** |
| (0.139) | (0.095) | (0.182) | (0.120) | (0.145) | (0.116) | |
| Income Scale | -0.370*** | 0.233*** | 0.306** | 0.144 | -0.137 | 0.155* |
| (0.105) | (0.072) | (0.137) | (0.090) | (0.110) | (0.087) | |
| Republican | 0.707*** | -0.038 | 0.113 | 0.136 | -0.010 | 0.086 |
| (0.112) | (0.086) | (0.167) | (0.110) | (0.134) | (0.108) | |
| Unemployed | 0.483*** | -0.252 | -0.203 | -0.165 | -0.195 | -0.454** |
| (0.182) | (0.158) | (0.364) | (0.198) | (0.241) | (0.192) | |
| Emancipative Values | -0.565*** | 0.356*** | 0.399*** | 0.883*** | -0.857*** | 0.547*** |
| (0.113) | (0.078) | (0.150) | (0.098) | (0.120) | (0.095) | |
| N | 4443 | 2430 | 1120 | 2426 | 2420 | 2427 |
| ***p < .01; **p < .05; *p < .1 | ||||||
Conclusion
Political commentators and the concerned general public could better understand the Trump phenonemon, with its implications for democracy in the United States, if they were familiar with the World Values Survey data. Cross-national survey researchers interested in attitudes toward executive authority and familiar with the data (like yours truly) had known about these developing trends in the United States for some time. We may not want to admit it, but American attitudes toward democracy are more fickle than we like to think.
The important findings from the analyses follow.
- Support for “strong leaders” may be on the rise in the West and among established democracies, but the levels of support for this kind of head of state in the U.S. and opposition to democracy are still conspicuous among the U.S.’ democratic peers.
- We do see a discernible rise of support for this kind of executive authority in the United States over successive waves of World Values Survey data.
- Education is an important correlate of this attitude toward a strong leader. The less educated are more open to this kind of executive authority in the United States.
- There is no simple story to race. White respondents are actually less likely than other racial/ethnic categories in the U.S. to support this kind of head of state. However, the effect of lower levels of education is stronger on white Americans.
- Republicans, all else equal, are actually less likely to prefer this kind of executive relative to non-Republicans. There is, however, a statistically significant negative interaction between lower levels of education (i.e. a high school diploma or less) and support for the Republican party in the most recent wave of World Values Survey data (2011).
- Americans who are more supportive of having a strong leader that does not have to bother with elections or Congress are more likely to hold attitudes about democracy in America that most political commentators and concerned citizens should think of as antithetical to democracy itself.
These findings cast doubt on how loyal Americans are to the concept of a democracy. I list two possible objections that an optimist about American democracy could raise about these analyses but I do not think they are sufficient to reject some of the implications of the analyses I report here.
The Wording of the “Strong Leader” Question Isn’t Quite Right
The World Values Survey aims for generality across a broad array of countries, including the United States. Its questions can be somewhat general, even vague, as a result. The reader should note that the “strong leader” question the World Values Survey asks in the United States does not use proper nouns. It does not say “President” and it does not explicitly say “Congress” in lieu of “parliament” either. The term “parliament” sounds odd to the typical American. As a result, the American who answers that question may not be thinking of the United States in his/her response. S/he could be playing with “house money” and that s/he would still reject that type of president when push comes to shove, even if s/he thinks it is a nice thought experiment for another country.
This is a valuable critique but I think even raising this critique circles us to the problem again. There is a large subset of Americans who, if we accept this critique, are open to the thought of having a head of state rule with discretion and without regular legislative or electoral oversight. They are not rejecting it outright even if they think of it as a nice thought experiment for another country. That can’t be ideal, per our extant scholarship on attitudes toward democracy.
This critique does not make it clear how Americans would automatically reject the anti-free press measures and unconstitutional policies someone like Trump is proposing if they think someone like Trump is just fine for another country. Why should we believe these Americans would know a would-be autocrat in the United States when they see him? And that they would reject that would-be autocrat as right for the United States?
“Winners and Losers”
One of my favorite misconceptions about democracy in political science is that it creates only winners and “really big winners”. Even the “losers” in a democratic election still get the benefit of public goods that do not typically follow exclusion from a winning coalition in an autocracy. This line of thinking pervades selectorate theory, one of the most influential theories of democracy in the discipline.
This is almost a nonsense statement. The benefits from being a “loser” may be better in a democracy than an autocracy, all else equal. This misses the fact that losers still feel like they lost, even in democracy. That may piss them off more than it may lead them to assure themselves, “well, at least we still get public roads and parks.”
Do note what this might mean for the strong leader problem in the World Values Survey data for the United States. Explore the random intercepts and conditional variances for the random effects in the first model. Do see how support for a strong leader in the South was higher in 1995 (i.e. not long after the GOP lost the White House in a presidential election for the first time since 1976) than it was in 2006 (when George W. Bush, of Texas, was in his second term). Do see that the coefficient for the interaction between lower levels of education and whether the respondent would vote Republican is statistically significant in 2011 but not over all four waves.
This might suggest some type of “winners and losers” effect where Republican respondents want a swift and total overhaul of policies implemented when a Democrat is in the White House (and vice-versa) that manifests in openness toward a hypothetical strong leader with the discretion to implement the policies they prefer. The implication is support for a strong leader is epiphenomenal to resting outside the “winning coalition” and that a return to the winning coalition (e.g. a Republican wins the White House in 2016) would lead a respondent to revisit his/her belief about the value of a strong leader for the United States.
This is also an important critique and may caution our inferences about the problem of values in favor of a strong leader that could rule by discretion. I do think it ultimately reiterates the same point I raised in the previous section. A Republican who wants a strong leader unencumbered by elections or Congress when a Democrat controls the White House still has a fickle loyalty to the concept of democracy. We may have a large group of Americans who believe in democracy the extent to which its regular elections produce winners they like.
I think we’re still stuck with noting this article from The Onion is closer to reality than satire.
Code and Footnotes
I make available the code and data for this analysis on my Github.
-
The U.S. actually does have some lingering territorial disputes (e.g. Seal Island, Navassa Island). These disputes lay dormant, do not define U.S. foreign policy, and are rarely militarized even at low levels, but the U.S. has both a revisionist claim it has pressed and a revisionist claim against it. I would be wrong not to code them. Further, a sample is a sample. The commentary amounted to a request to gerrymander the data at that audience member’s discretion. ↩
-
European Values Survey did not appear to take a survey in the mid-1990s, which makes its third wave in the late 1990s coincide with the World Values Survey’ fourth wave. I recode the EVS’ wave to match the WVS’ wave variable to match both temporally. ↩
-
These are Canada, Australia, New Zealand and all countries in Europe that appear in either European Values Survey or World Values Survey that are not Turkey or were constituent parts of the former Yugoslavia or the Soviet Union. I do include a few former Warsaw Pact countries (e.g. Czech Republic, Hungary, Poland, and Slovakia) because they were nominally independent during the Cold War and are part of the European Union (and even NATO). ↩
-
The
autonomycomponent resembles the familiar child autonomy index that values researchers should know well as the basic proxy for authoritarian values. However, this is just a three-variable measure that evaluates whether a respondent believes children should learn independent, imagination and not obedience among the child qualities mentioned. Thechoicecomponent is a three-variable component that probes how justifiable a respondent believes abortion, divorce, and homosexuality are on a ten-point scale. Theequalitycomponent is primarily concerned with attitudes toward women and probes attitudes toward gender equality on the job, in politics, and educational opportunites. The last component,voice, is a two-variable component concerned with whether a respondent believe that a country’s political priorities or the respondent’s personal political priorities involve giving people more of a voice in how their country is governed. ↩ -
Republicans as World Values Survey roughly codes them are about 37% of the sample. Democrats are 49%. Independents and those who would vote for the Reform Party (remember them?) and other parties constitute the remaining 14%. ↩
-
The parameter for the GOP independent variable is apparent and eye-opening in the first model in the second table but I’m also aware that I could likely get into hot water as an untenured professor if I were to provide too much commentary about the inferential implications. I’ll leave those inferences and implications entirely to the reader. It’s actually negative and statistically significant in the second model (importance of democracy) if the party variable were subset to just Republicans and Democrats, as I had done in a previous version of these analyses. ↩
Disqus is great for comments/feedback but I had no idea it came with these gaudy ads.