What Can Survey Data Tell Us About Public Opinion and the Gun Control Debate?
This Blog Post is Now a Peer-Reviewed Paper ⤵️
This was an end-of-the-semester diversion from grading and I was happy to get a publication out of it at Social Science Quarterly. A lot remains the same empirically, except for the addition of the 2016 wave of GSS data, the addition of another control variable for rural respondents, and a few auxiliary analyses on top of that.
Suggested Citation:
Miller, Steven V. 2019. "What Americans Think About Gun Control: Evidence from the General Social Survey, 1972-2016." Social Science Quarterly 100(1): 272--288.
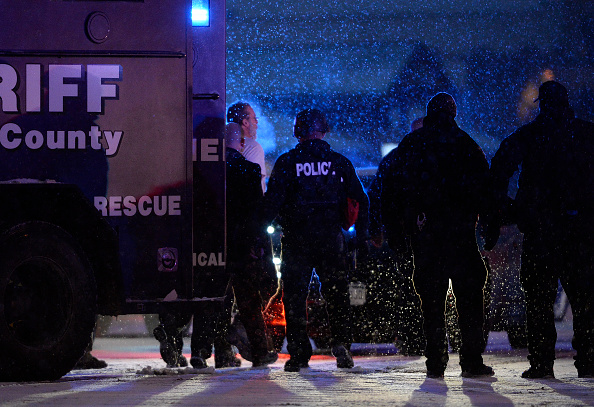
- Police take Robert Lewis Dear into custody after a mass shooting at a Colorado Springs Planned Parenthood.
The recent terrorist incidents in Colorado Springs and San Bernardino have renewed public interest in the gun control debate. The New York Daily News ran a provocative front-page image that implored high-ranking politicians to abandon the proverbial “thoughts and prayers” as little more than cheap rhetoric from legislators who would rather not, well, “legislate” on this particular issue. A follow-up front-page cover on the San Bernardino incident engaged in deliberate issue-linkage of the San Bernardino terrorist incident with semi-automatic rampages in Newtown and Aurora, among, sadly, several others.
The New York Times even dusted off a device it had not used in 95 years—the front-page editorial—to argue that our legislators’ inability to push sensible gun control legislation into law is a “moral outrage and national disgrace”.
The New York Daily News and New York Times are making these demonstrations because gun control legislation is a non-starter in Congress. Senate Republicans voted down legislation that would have closed background check loopholes and banned subjects on the terror watch list from purchasing firearms. GOP opposition to the bill was almost unanimous, which conforms to the preferences of the National Rifle Association on this issue.
We tend to believe gun control legislation is a non-starter in Congress because the issue is heavily polarized. Democrats push the issue and Republicans are almost unanimous in their opposition to gun control. If, as we commonly believe, citizens are becoming increasingly polarized too (or at least better “sorted”), then gun control pushes by partisan Democrats are unlikely to become law against strong opposition.1 For gun control advocates, a veto threat from Democrats may make further gun deregulation less likely. This, at least, constitutes a silver lining.
What can public opinion data tell us about this debate? For those of who have poked around General Social Survey data before, the answers are somewhat surprising. They certainly surprise students in my quantitative methods class when gun control political attitude data appear in the assigned texts. In what follows, I use General Social Survey (GSS) data from 1972 to 2014 to illustrate some of the broader patterns on partisanship and support for gun control at the individual-level.
GOP Partisanship Does Not Robustly Reduce Support for Gun Control…
Partisanship might be our go-to explanation for individual-level support for gun control. However, the partisanship-gun control relationship is not nearly as robust at the individual-level as we infer it to be at the elite-level.
I conducted a regression analysis of six questions on the topic of gun control. The first question concerns whether a police permit is required before a citizen could purchase a gun. This is the most ubiquitous gun control question in GSS and appears in every survey from 1972 to 2014, except for surveys in 1978, 1983, and 1986. The next five questions appear in just the 2006 wave of GSS. These concern whether background checks should be required for private gun sales, whether tougher penalties should be imposed on individuals for illegal gun sales than those imposed on selling drugs, whether semi-automatic weapons should be the exclusive domain of the police and military (i.e. no sales to the public), whether the respondent would support proposed state laws that would make it illegal to carry a gun while drunk, and whether the respondent believes gun control laws should be stricter after 9/11. All six responses are recoded as binary with recoded responses of 1 indicating support for a gun control measure.
I kept my independent variables rather minimal. I include the age of the respondent and standardize it by two standard deviations, centered on the mean for the year (and not the global mean).2 I include dummies for the college educated and women. I break GSS’ three-category race variable into two fixed effects for black respondents and “other” (i.e. not white) respondents. This leaves white respondents in the baseline. I include (and standardize, like the age variable) the six-point party identification variable. Increasing values indicate stronger affiliation with the Republican party.3 Finally, I code whether the respondents reports having a gun in his or her home. This variable serves as a crude proxy for the salience of guns to the respondent.
The models summarized in the following table are mixed effects logistic regressions. I include random effects for the year (in the first model) and condensed Census regions in all six models. I also allow the effect of party identification to vary by region and year.
| Require Police Permit? | Background Check for Private Sales? | Tougher Penalties than Selling Drugs? | Limit Semi-Automatics to Police/Military? | Illegal to Carry a Gun while Drunk? | Tougher Gun Control Laws after 9/11? | |
| Model 1 | Model 2 | Model 3 | Model 4 | Model 5 | Model 6 | |
| Age | 0.085*** | -0.049 | 0.343** | 1.234*** | 0.164 | 0.071 |
| (0.028) | (0.181) | (0.146) | (0.251) | (0.258) | (0.215) | |
| College Educated | 0.338*** | 0.598*** | -0.162 | 0.457 | 0.349 | 0.113 |
| (0.036) | (0.231) | (0.168) | (0.283) | (0.317) | (0.252) | |
| Female | 0.661*** | 0.955*** | 0.109 | 2.041*** | 0.628** | 1.219*** |
| (0.028) | (0.186) | (0.150) | (0.264) | (0.256) | (0.217) | |
| Black | 0.122*** | -0.253 | 0.884*** | 0.547 | -0.515 | -0.191 |
| (0.046) | (0.291) | (0.242) | (0.438) | (0.389) | (0.378) | |
| Other Race (Not White) | 0.361*** | -0.202 | 0.873*** | 1.045** | -0.396 | 0.342 |
| (0.075) | (0.332) | (0.279) | (0.472) | (0.417) | (0.425) | |
| Party ID (D to R) | -0.388*** | -0.283 | 0.082 | -0.360 | -0.287 | -0.558** |
| (0.068) | (0.206) | (0.171) | (0.246) | (0.341) | (0.275) | |
| Gun in the Household | -0.983*** | -0.529*** | -0.603*** | -1.288*** | -0.063 | -1.198*** |
| (0.029) | (0.191) | (0.160) | (0.245) | (0.277) | (0.221) | |
| Constant | 1.354*** | 1.092*** | 0.166 | 1.472*** | 2.158*** | 1.640*** |
| (0.141) | (0.197) | (0.262) | (0.275) | (0.296) | (0.320) | |
| N | 34234 | 838 | 835 | 832 | 842 | 790 |
| ***p < .01; **p < .05; *p < .1 | ||||||
The results here tell a mixed story about the effect of increasing partisanship with the GOP on support (rather: opposition) to gun control legislation. The most precise effect is observed in the first model that estimates whether a respondent believes a potential gun-owner should obtain a permit from the police before purchasing a weapon. A change across two standard deviations in the distribution of this variable (i.e. about 47.7% of the data) leads to a decrease of -.388 in the logged odds of support for this hypothetical gun control measure. There is a similar discernible effect of partisanship on opposition to tougher gun control measures after 9/11. An increase of two standard deviations across the partisanship variable leads to a decrease of -.558 in the logged odds of support for tougher gun control measures as a response to 9/11.
While this might be disconcerting for gun control advocates, I do wonder how informative this question is. It appears just once (in the 2006 wave of GSS). While it does frame the respondent to think of 9/11 in answering this question, it does not connect terrorists as potential firearm purchasers or owners. We know now this is an issue in the San Bernardino case. The attackers in that case were American citizens who purchased their weapons legally in advance of a terrorist attack.
…and Most Republicans Actually Support Gun Control
This is the most confusing thing for my students to learn. When I talk about making comparisons with basic cross-tabulation in my quantitative methods class, the first things students see in the relevant slide from that lecture is that 68.8% of Republicans support a law that would require a person to obtain a police permit before he or she could buy a gun. They miss that 87% of Democrats support it and that 79% of independents support it. They miss the observable effect of partisanship that I try to show them, even if that particular statistic about Republicans stands at odds with conventional wisdom.
That observation in GSS from 2006 is more than just an anomaly that defies conventional wisdom. It’s a trend. There is not a year in GSS in which support for a law that would require a police permit among the strong Republicans is below 54%.
| Party ID | 1972 | 1973 | 1974 | 1975 | 1976 | 1977 | 1980 | 1982 | 1984 | 1985 | 1987 | 1988 | 1989 | 1990 | 1991 | 1993 | 1994 |
| Strong Dem. | 75.16 | 79.56 | 78.28 | 76.73 | 71.62 | 76.47 | 74.86 | 75.94 | 76.45 | 78.33 | 74.64 | 80.79 | 82.32 | 85.57 | 84.25 | 87.82 | 87.97 |
| Not Strong Dem. | 73.57 | 76.34 | 78.2 | 80.88 | 76.19 | 72.45 | 75 | 77.45 | 77.09 | 72.38 | 73.64 | 80.9 | 87.05 | 84.1 | 83.16 | 86.05 | 84.32 |
| Indep., lean Dem. | 69.43 | 74.87 | 76.81 | 70.67 | 73.3 | 74.75 | 69.79 | 74.48 | 75.24 | 79.87 | 75.85 | 73.6 | 77.91 | 82.35 | 83.75 | 83.85 | 82.06 |
| Independent | 69.23 | 77.86 | 74.1 | 71.29 | 67.54 | 74.27 | 72.57 | 75.69 | 72.85 | 67.83 | 70.9 | 77.88 | 72.5 | 78.85 | 78.4 | 79.03 | 79.92 |
| Indep., lean GOP | 68.69 | 68.57 | 70.19 | 71.9 | 70.48 | 63.28 | 65.29 | 72 | 65.16 | 70.51 | 68.71 | 73.33 | 68 | 70.48 | 80.91 | 86 | 72.19 |
| Not Strong GOP | 70.22 | 69.77 | 75 | 77.09 | 71.63 | 73.06 | 66.36 | 70.95 | 69.58 | 71.76 | 76.34 | 69.19 | 79.17 | 79.37 | 79.06 | 74.19 | 74.77 |
| Strong GOP | 76.86 | 73.55 | 73.83 | 73.33 | 73.96 | 72.38 | 61.82 | 62.5 | 63.56 | 71.51 | 66.89 | 72.04 | 74.79 | 77.68 | 85.34 | 82.4 | 67.77 |
| Party ID | 1996 | 1998 | 2000 | 2002 | 2004 | 2006 | 2008 | 2010 | 2012 | 2014 |
| Strong Dem. | 88.05 | 86.75 | 90.11 | 90.77 | 86.47 | 87.37 | 87.3 | 84.13 | 85.9 | 87.37 |
| Not Strong Dem. | 87.04 | 86.49 | 85.23 | 85.71 | 85.19 | 86.27 | 84.47 | 78.33 | 78.54 | 83.93 |
| Indep., lean Dem. | 84.91 | 88.53 | 86.89 | 78.12 | 80.39 | 83.94 | 84.3 | 84.62 | 76.06 | 80.37 |
| Independent | 80.27 | 84.28 | 84.14 | 84.76 | 81.21 | 79.18 | 81.19 | 73.59 | 73.88 | 68.15 |
| Indep., lean GOP | 76.47 | 84.77 | 75.74 | 67.57 | 71.43 | 74.24 | 65.05 | 60.16 | 59.22 | 49.4 |
| Not Strong GOP | 81.55 | 76.97 | 77.99 | 75.5 | 80 | 74.92 | 69.7 | 71.75 | 70.12 | 65.05 |
| Strong GOP | 71.05 | 76.67 | 65.19 | 69.39 | 65.52 | 71.17 | 68.28 | 58.97 | 54.62 | 59.54 |
I use information like this to tell students to be mindful of what the regression actually communicates. The regression coefficient communicates a negative relationship of partisanship with the GOP on support for gun control that is statistically discernible from a zero relationship. This effect is discernible across the entire range of the independent variable.
Do take care to internalize the difference between a wrong inferential statement and the correct inferential statement. That statistically significant negative coefficient does not tell us that the typical strong Republican is likely to oppose gun control. Instead, that typical strong Republican is just less likely to support gun control than someone with lesser affiliation to the GOP, all things equal.
We can further illustrate this with post-estimation simulation using the Zelig package.4 I re-estimated Model 1 in Zelig with just the raw score of party identification (i.e. from 0 to 6). Thereafter, I set explanatory variables at their typical values (which happens to be white respondents around age 51 without a college education). I set the party identification variable to be at its maximum (i.e. strong Republicans) and allow the gun ownership variable and gender variable to vary.
| Category | Expected Value |
95% Interval |
|---|---|---|
| Female, Strong GOP, Doesn't Own Gun | .842 | (.799, .880) |
| Men, Strong GOP, Doesn't Own Gun | .738 | (.663, .792) |
| Female, Strong GOP, Gun Owners | .670 | (.601, .739) |
| Men, Strong GOP, Gun Owners | .510 | (.433, .595) |
| Men, Strong GOP, Gun Owners, College Educated | .590 | (.511, .666) |
The simulations show that the point estimates for expected value of support for police permits for handgun purchases, given the explanatory variables (e.g. women/men, strong GOP, owns gun/does not own a gun) are above .500 in every application. Further, the 95% interval for all expected values from the simulations are above .500 in all but one category—men with strong GOP affiliation, no college education, and with a gun in the home. Among those men who strongly identify as Republicans, who do own a gun, and are college educated in the analysis, the expected value of support for police permits rises to a mean of .590 and a 95% distribution of expected values that are above .500.
Among the respondents in the analysis with the strongest conceivable affiliation with the Republican party, most still prefer gun control measures. I withhold simulations for the other five models I estimate, but the descriptive statistics below support a similar interpretation. Obviously, Republican support for making penalties for illegal gun sales tougher than penalties for selling illicit drugs is somewhat lukewarm. However, this constitutes a particularly difficult support for gun control scenario given the support for the “War on Drugs” we typically afford to strong Republicans.
| Party ID | Background Check for Private Sales? | Tougher Penalties than Selling Drugs? | Limit Semi-Automatics to Police/Military? | Illegal to Carry a Gun while Drunk? | Tougher Gun Control Laws after 9/11? |
| Strong Dem. | 80.65 | 67.20 | 90.86 | 88.71 | 91.40 |
| Not Strong Dem. | 84.46 | 56.48 | 88.60 | 90.16 | 83.94 |
| Indep., lean Dem. | 82.24 | 57.24 | 90.79 | 92.11 | 86.84 |
| Independent | 74.76 | 56.19 | 86.19 | 90 | 82.86 |
| Indep., lean GOP | 78.72 | 56.38 | 85.11 | 92.55 | 81.91 |
| Not Strong GOP | 80.81 | 46.97 | 83.33 | 93.43 | 77.78 |
| Strong GOP | 79.87 | 51.68 | 80.54 | 89.93 | 73.15 |
Gun Control Isn’t Necessarily a Partisan Issue, but It’s Becoming One
Most Republicans are on board with gun control measures. However, we are observing a growing rift between left and right on this issue that seems to occur entirely during the Obama Administration.
The table above that shows percentage of respondents supporting police permits before handgun purchases, by party identification and year, suggests such a rift that begins in 2010. Recall, the mixed effects models from the regression table allow for different year and region random effects. In the first model, they also allow the effect of party identification to vary by region and, in Model 1, by year.
A caterpillar plot of the random effects associated with Model 1 also shows this same effect.
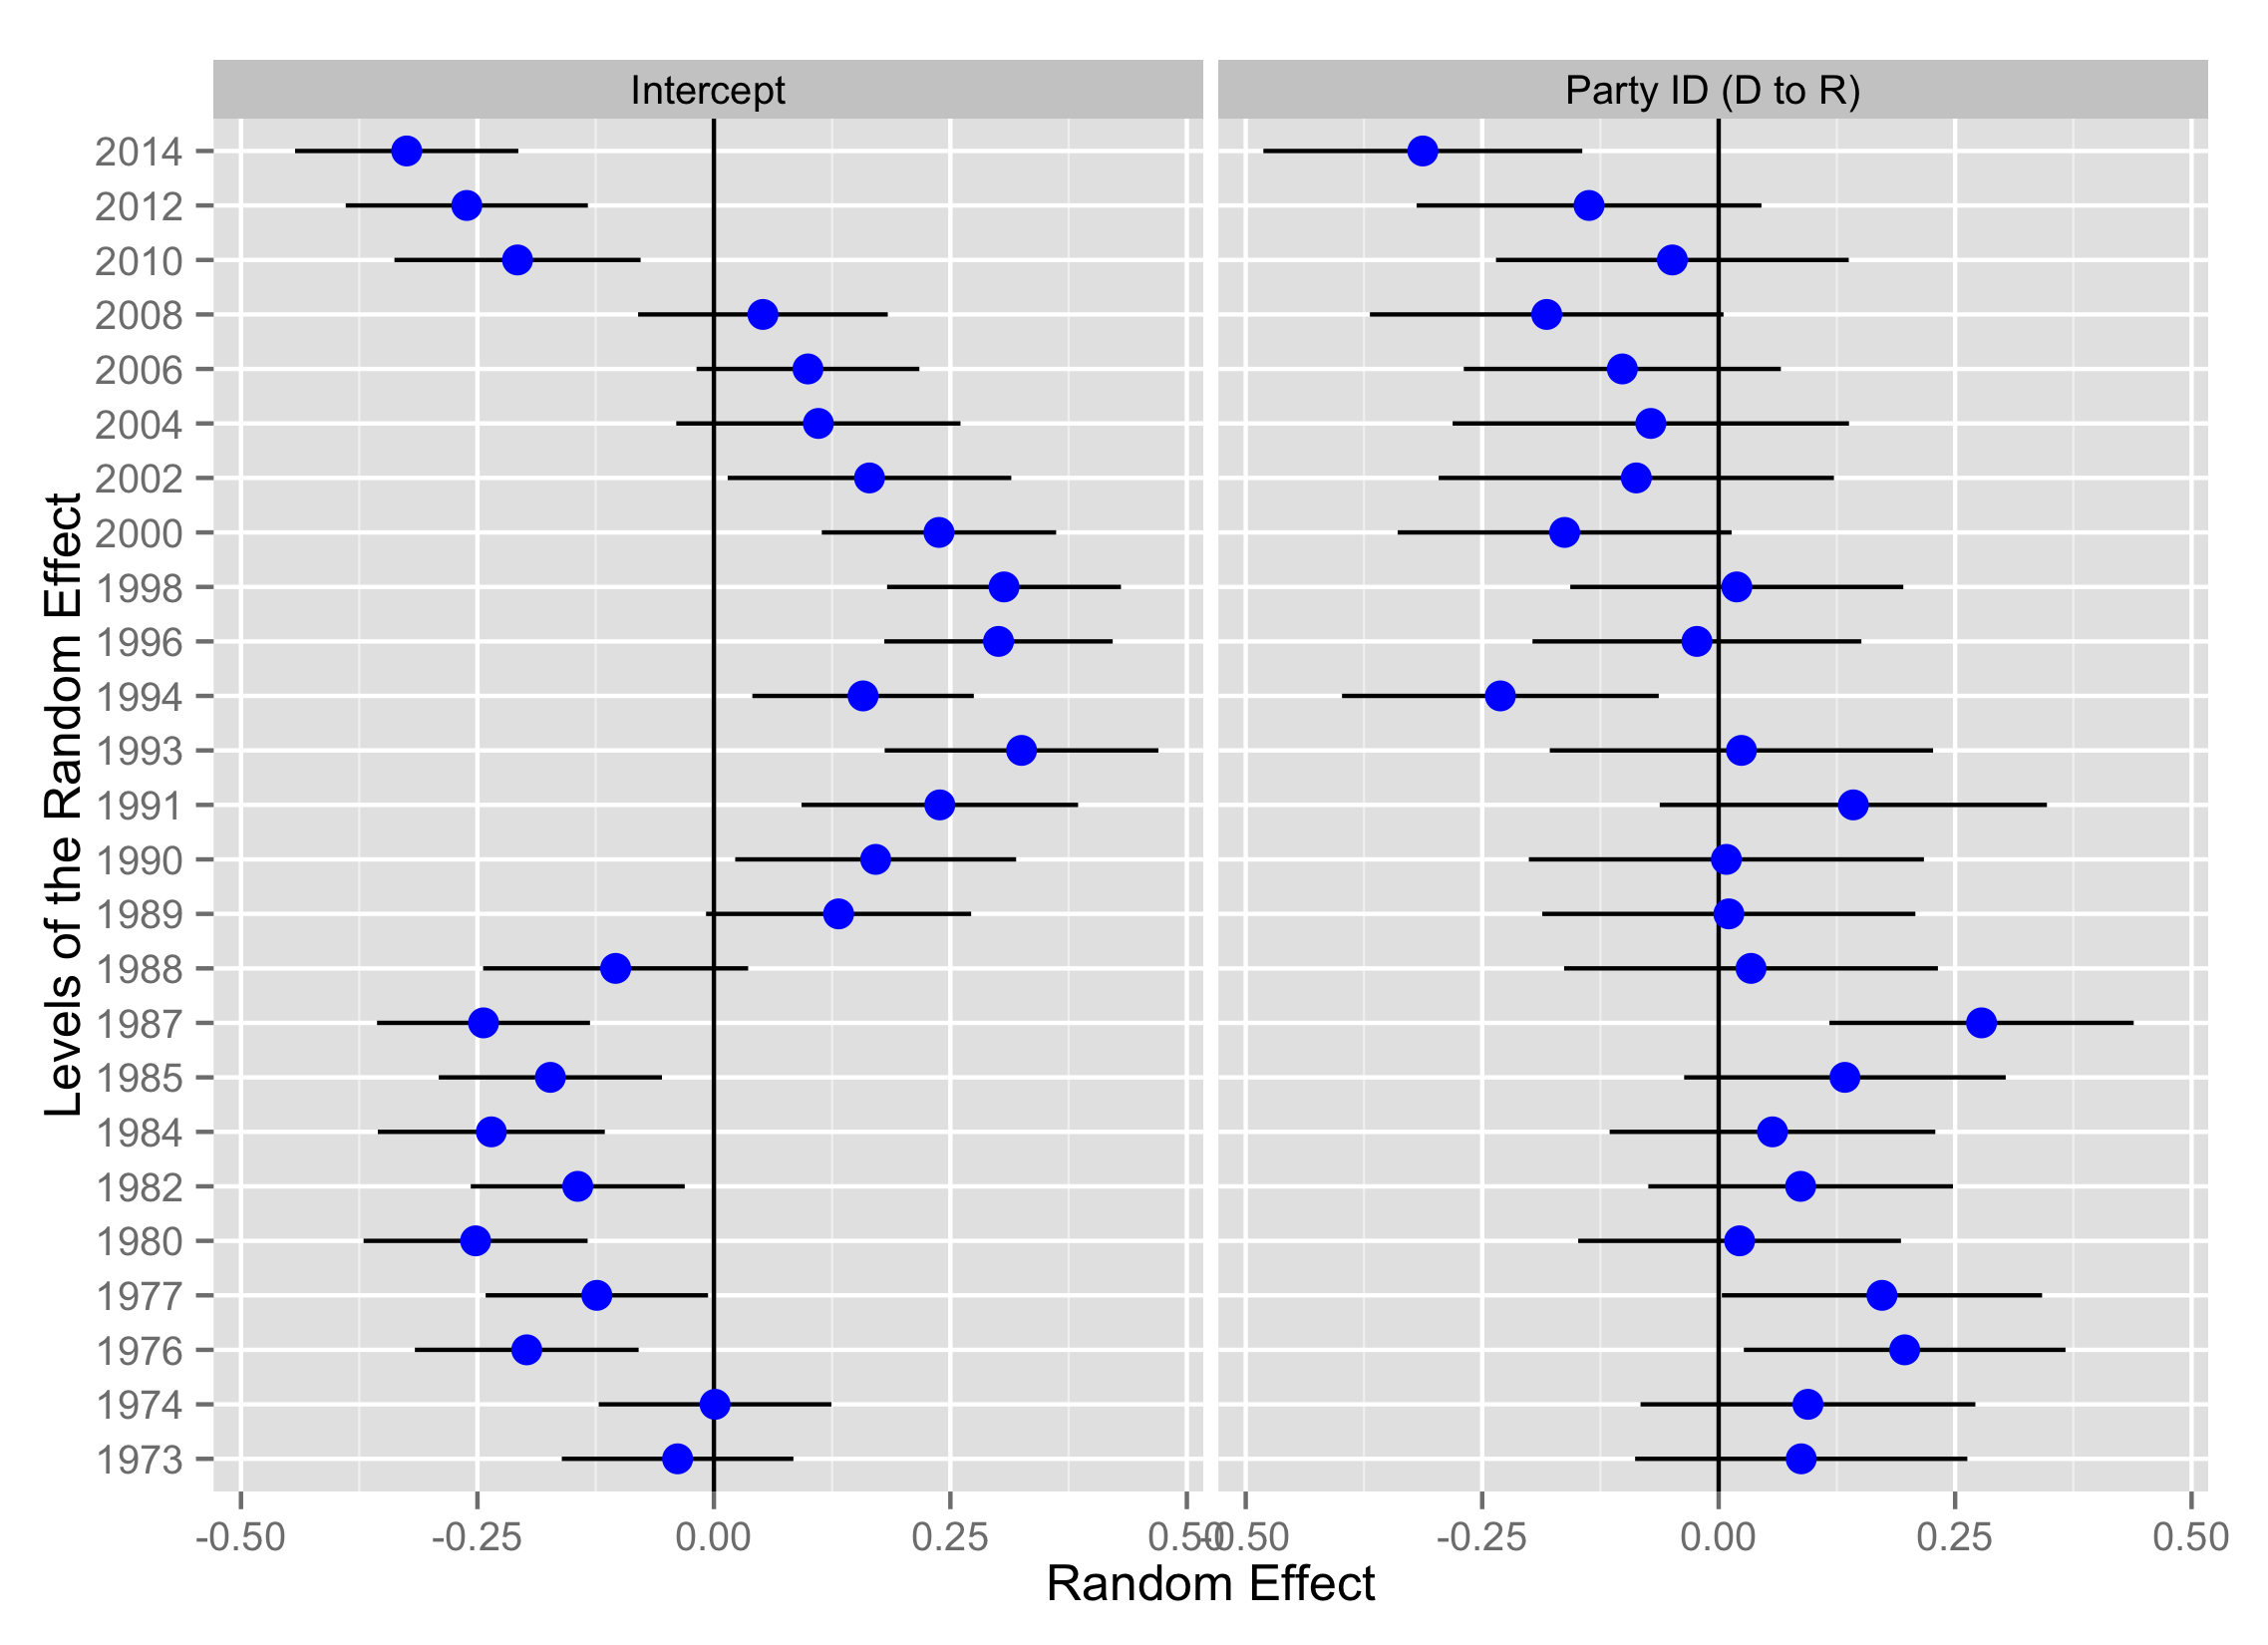
- A caterpillar plot of the random effects in Model 1 (support for police permits) with random intercept for year and random slope for party ID.
I will defer a more exhaustive, technical interpretation of mixed effects models to canonical texts like those provided by Douglas Luke or Andrew Gelman and Jennifer Hill (which is how I taught myself mixed effects modeling).5 For the casual reader, think of the random intercepts (here: year and region in Model 1) as different “starting points”. Some years may have higher than “average” support or opposition to requiring police permits for handgun purchases. In addition, think about the random slope of party identification as saying that the effect of increasing partisanship with the GOP may be stronger in some years and regions than they were in other years or regions. It may also be weaker than average in some other years.
That’s what this caterpillar plot shows. Notice the intercepts for the years in the 1970s were below zero (i.e. the global mean from the data or “the national average”). That is, respondents in the 1970s and mid-1980s were less likely to support a law that required police permits in order to obtain a handgun when compared to the global average. Some of these years also include “confidence intervals” (of sorts) that do not overlap zero. In other words, we can say that respondents in 1987 (for example) were discernibly more against this particular gun control measure than respondents on average. This changes in 1989 and into the 1990s and 2000s. Overall, respondents were more likely to support this gun control measure during this time than citizens overall, on average.
I could not offer a substantive explanation for this phenomenon since it rests outside my expertise. If I had to guess, the 1970s were a period of such notoriously high crime that citizens may have wanted a gun for their own protection without needing police permission. The change around 1988 and 1989 coincides with the first Bush Administration. Crime became a prominent national political issue (from my early recollections) and led to several national initiatives (or, at least, discussions) that carried into the Clinton Administration.
The change around the Obama Administration coincides with prominent events like the spike in gun sales after Obama’s election in 2008. Notice too the change of party identification. On average, Republicans are less likely to support this gun control measure than those whose political affinities gravitate more to the Democratic Party. However, this caterpillar plot shows that the effect of GOP partisanship is stronger in 2014 than it is overall. The effect of GOP partisanship decreases support for gun control even more in 2014 in addition to the overall decrease in support for GOP partisanship on average.
Most Republicans actually support gun control measures and the issue at stake is not necessarily as polarizing at the individual-level as it is at the elite-level. However, it is rather quickly becoming a partisan issue among the electorate.
The South is Peculiar, but Not in the Way You’d Expect
The casual observer might think this is more a function of respondents in the South. After all, most electoral votes rest in the South than any other region. Southerners, we think, tend to love their guns (for whatever purpose) and will elect politicians who will fight hard for their interpretation of the Second Amendment to the U.S. Constitution.
The truth is there is more happening in the South than meets the eye. A caterpillar plot for the random effects in Model 1 (not shown here) suggests that respondents in the South are, on average, less likely to support police permits for handgun purchases. However, the estimated intercept for the South is actually greater (i.e. closer to zero) than the estimated intercept for the West region. The intercepts for both are discernible from zero, but we have preliminary evidence that opposition to gun control may be more pronounced in the West than in the South.6
However, the effect of GOP partisanship is positive in the South from 1972 to 2014. The more Republican the respondent is in the South from 1972 to 2014, the more likely that respondent supports requiring a police permit for handgun purchases. However, this might be a function of politics in the South before the sorting of the electorate. Notice the random effects for region from a model that includes just years from 1972 to 1993 and contrast it with a model that includes the years from 1994 to 2014.
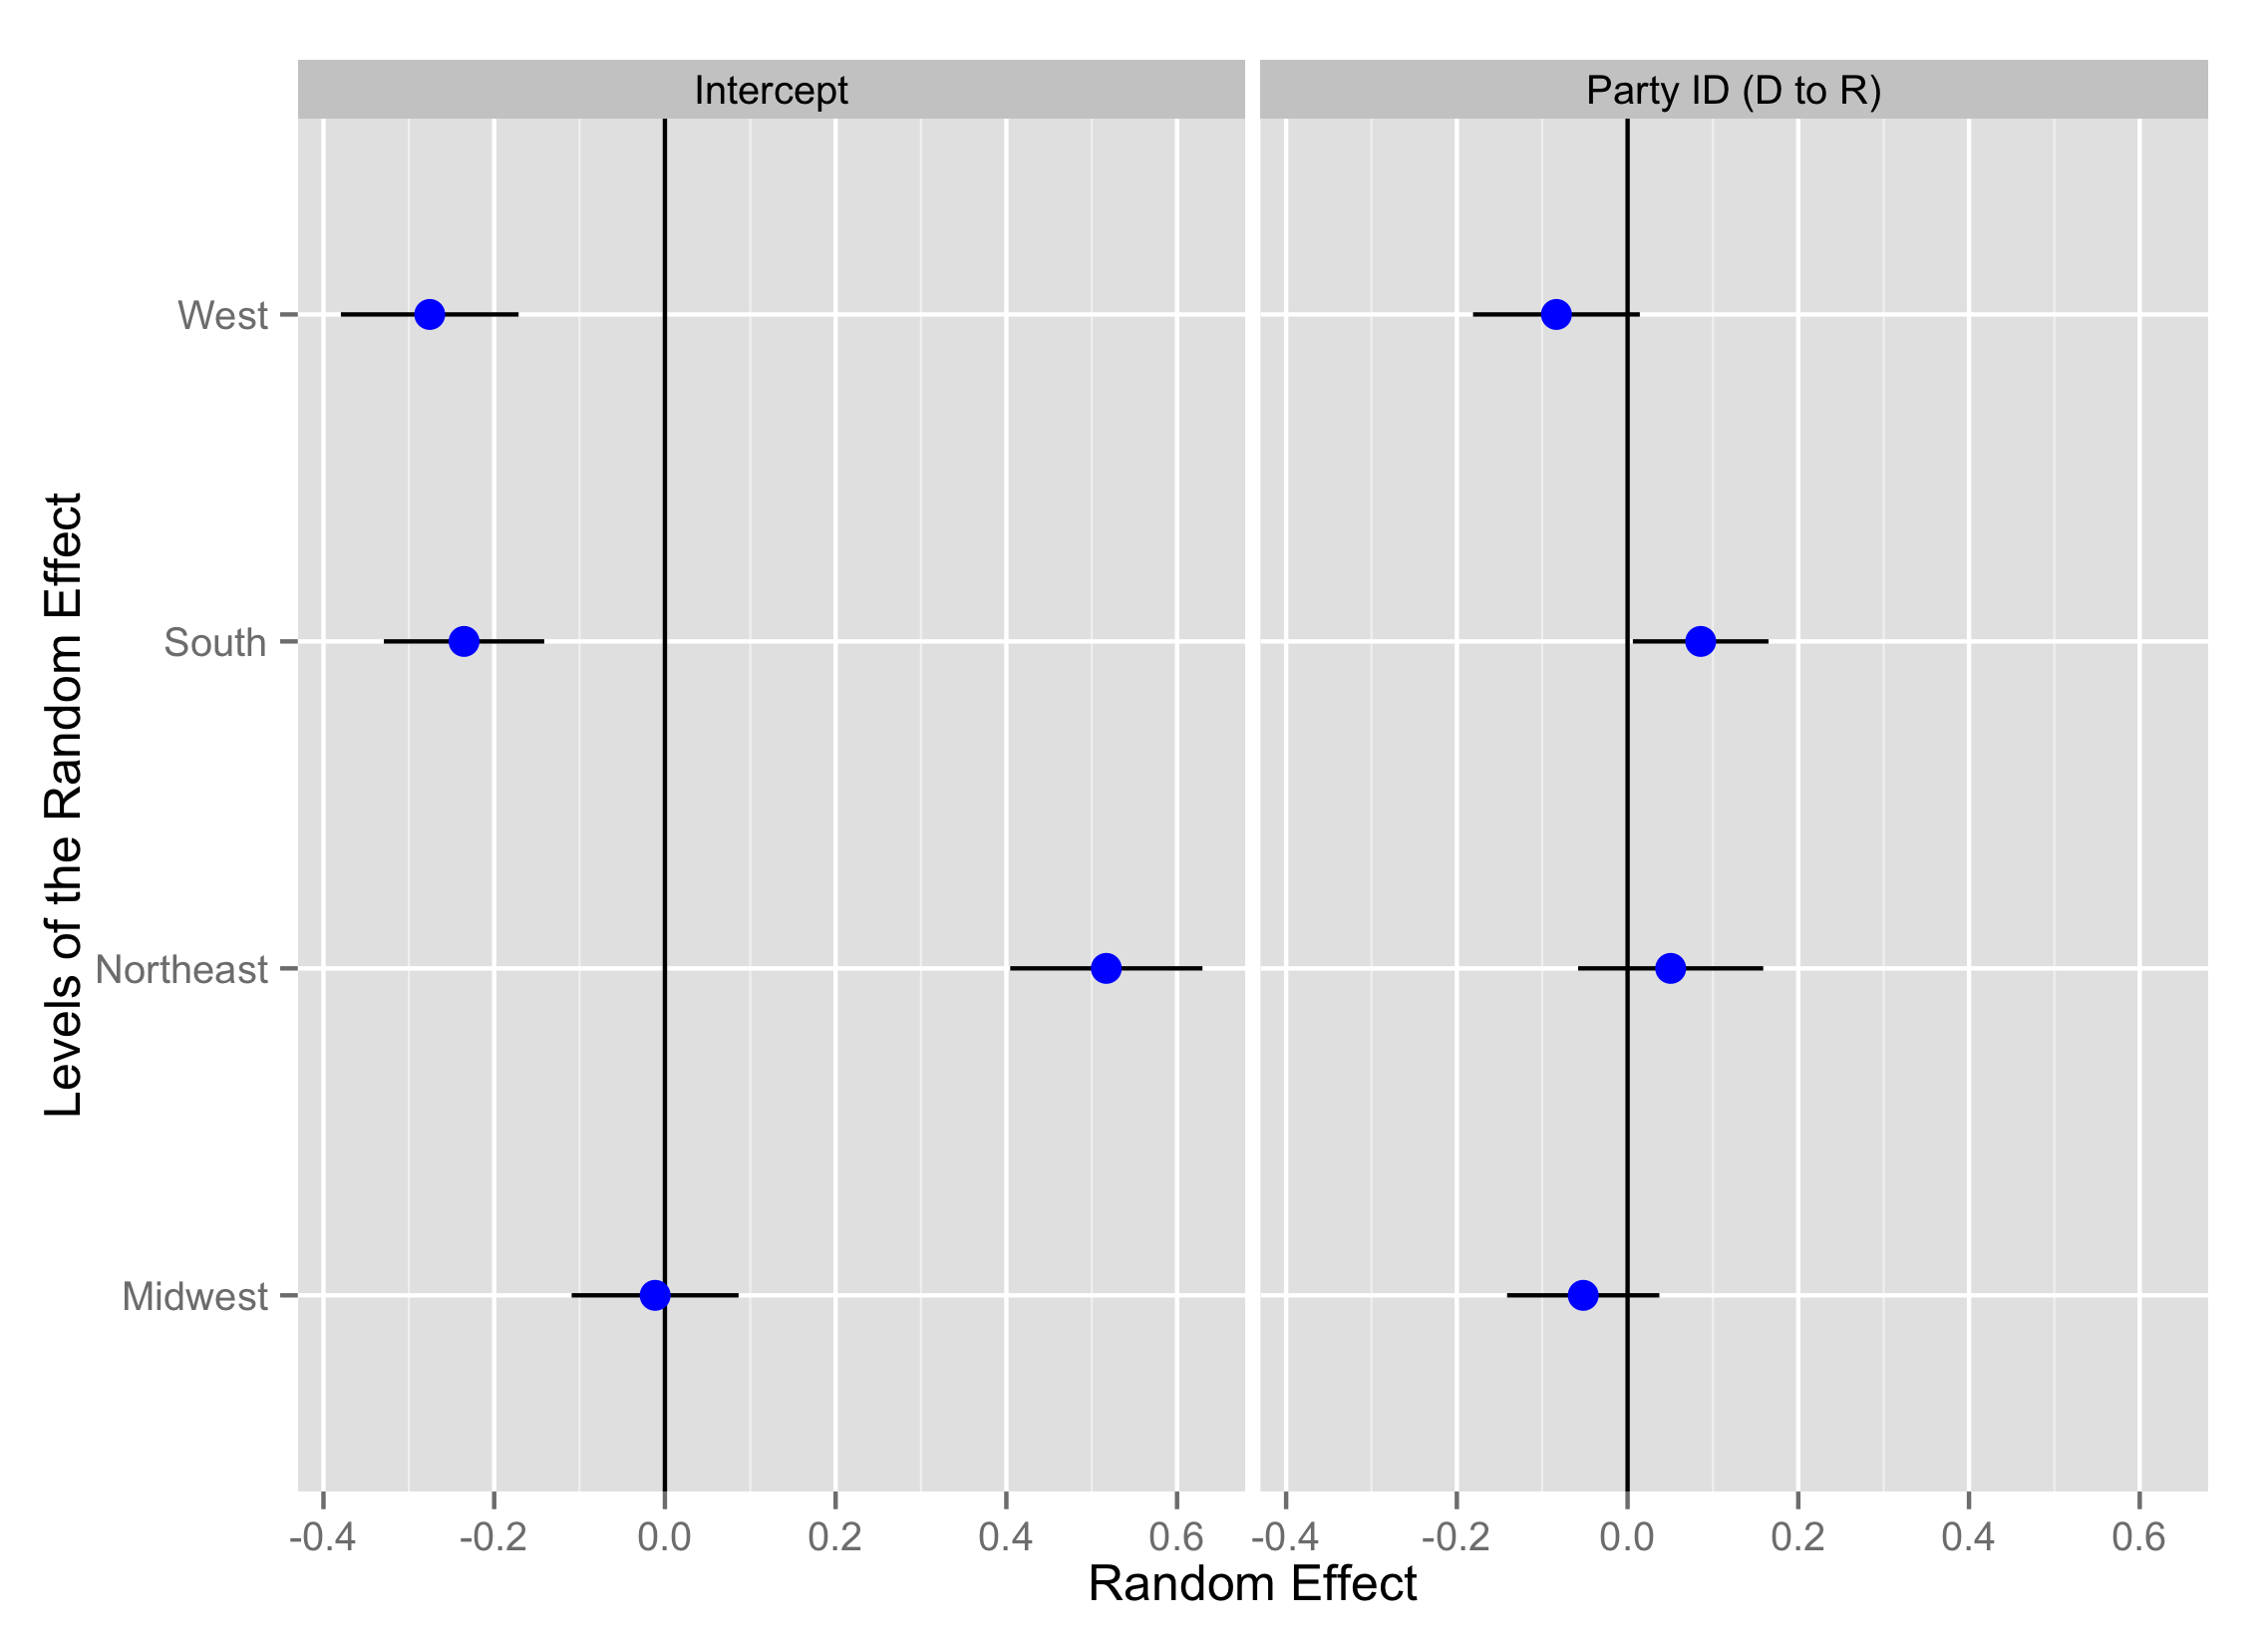
- A caterpillar plot of the random effects in Model 1 (support for police permits) with random intercept for region and random slope for party ID (1972-1993).
In years after the Republican Revolution, there is no discernible effect of GOP partisanship on support for police permits for handgun purchases in the South, nor is the South distinguishable from the other regions.
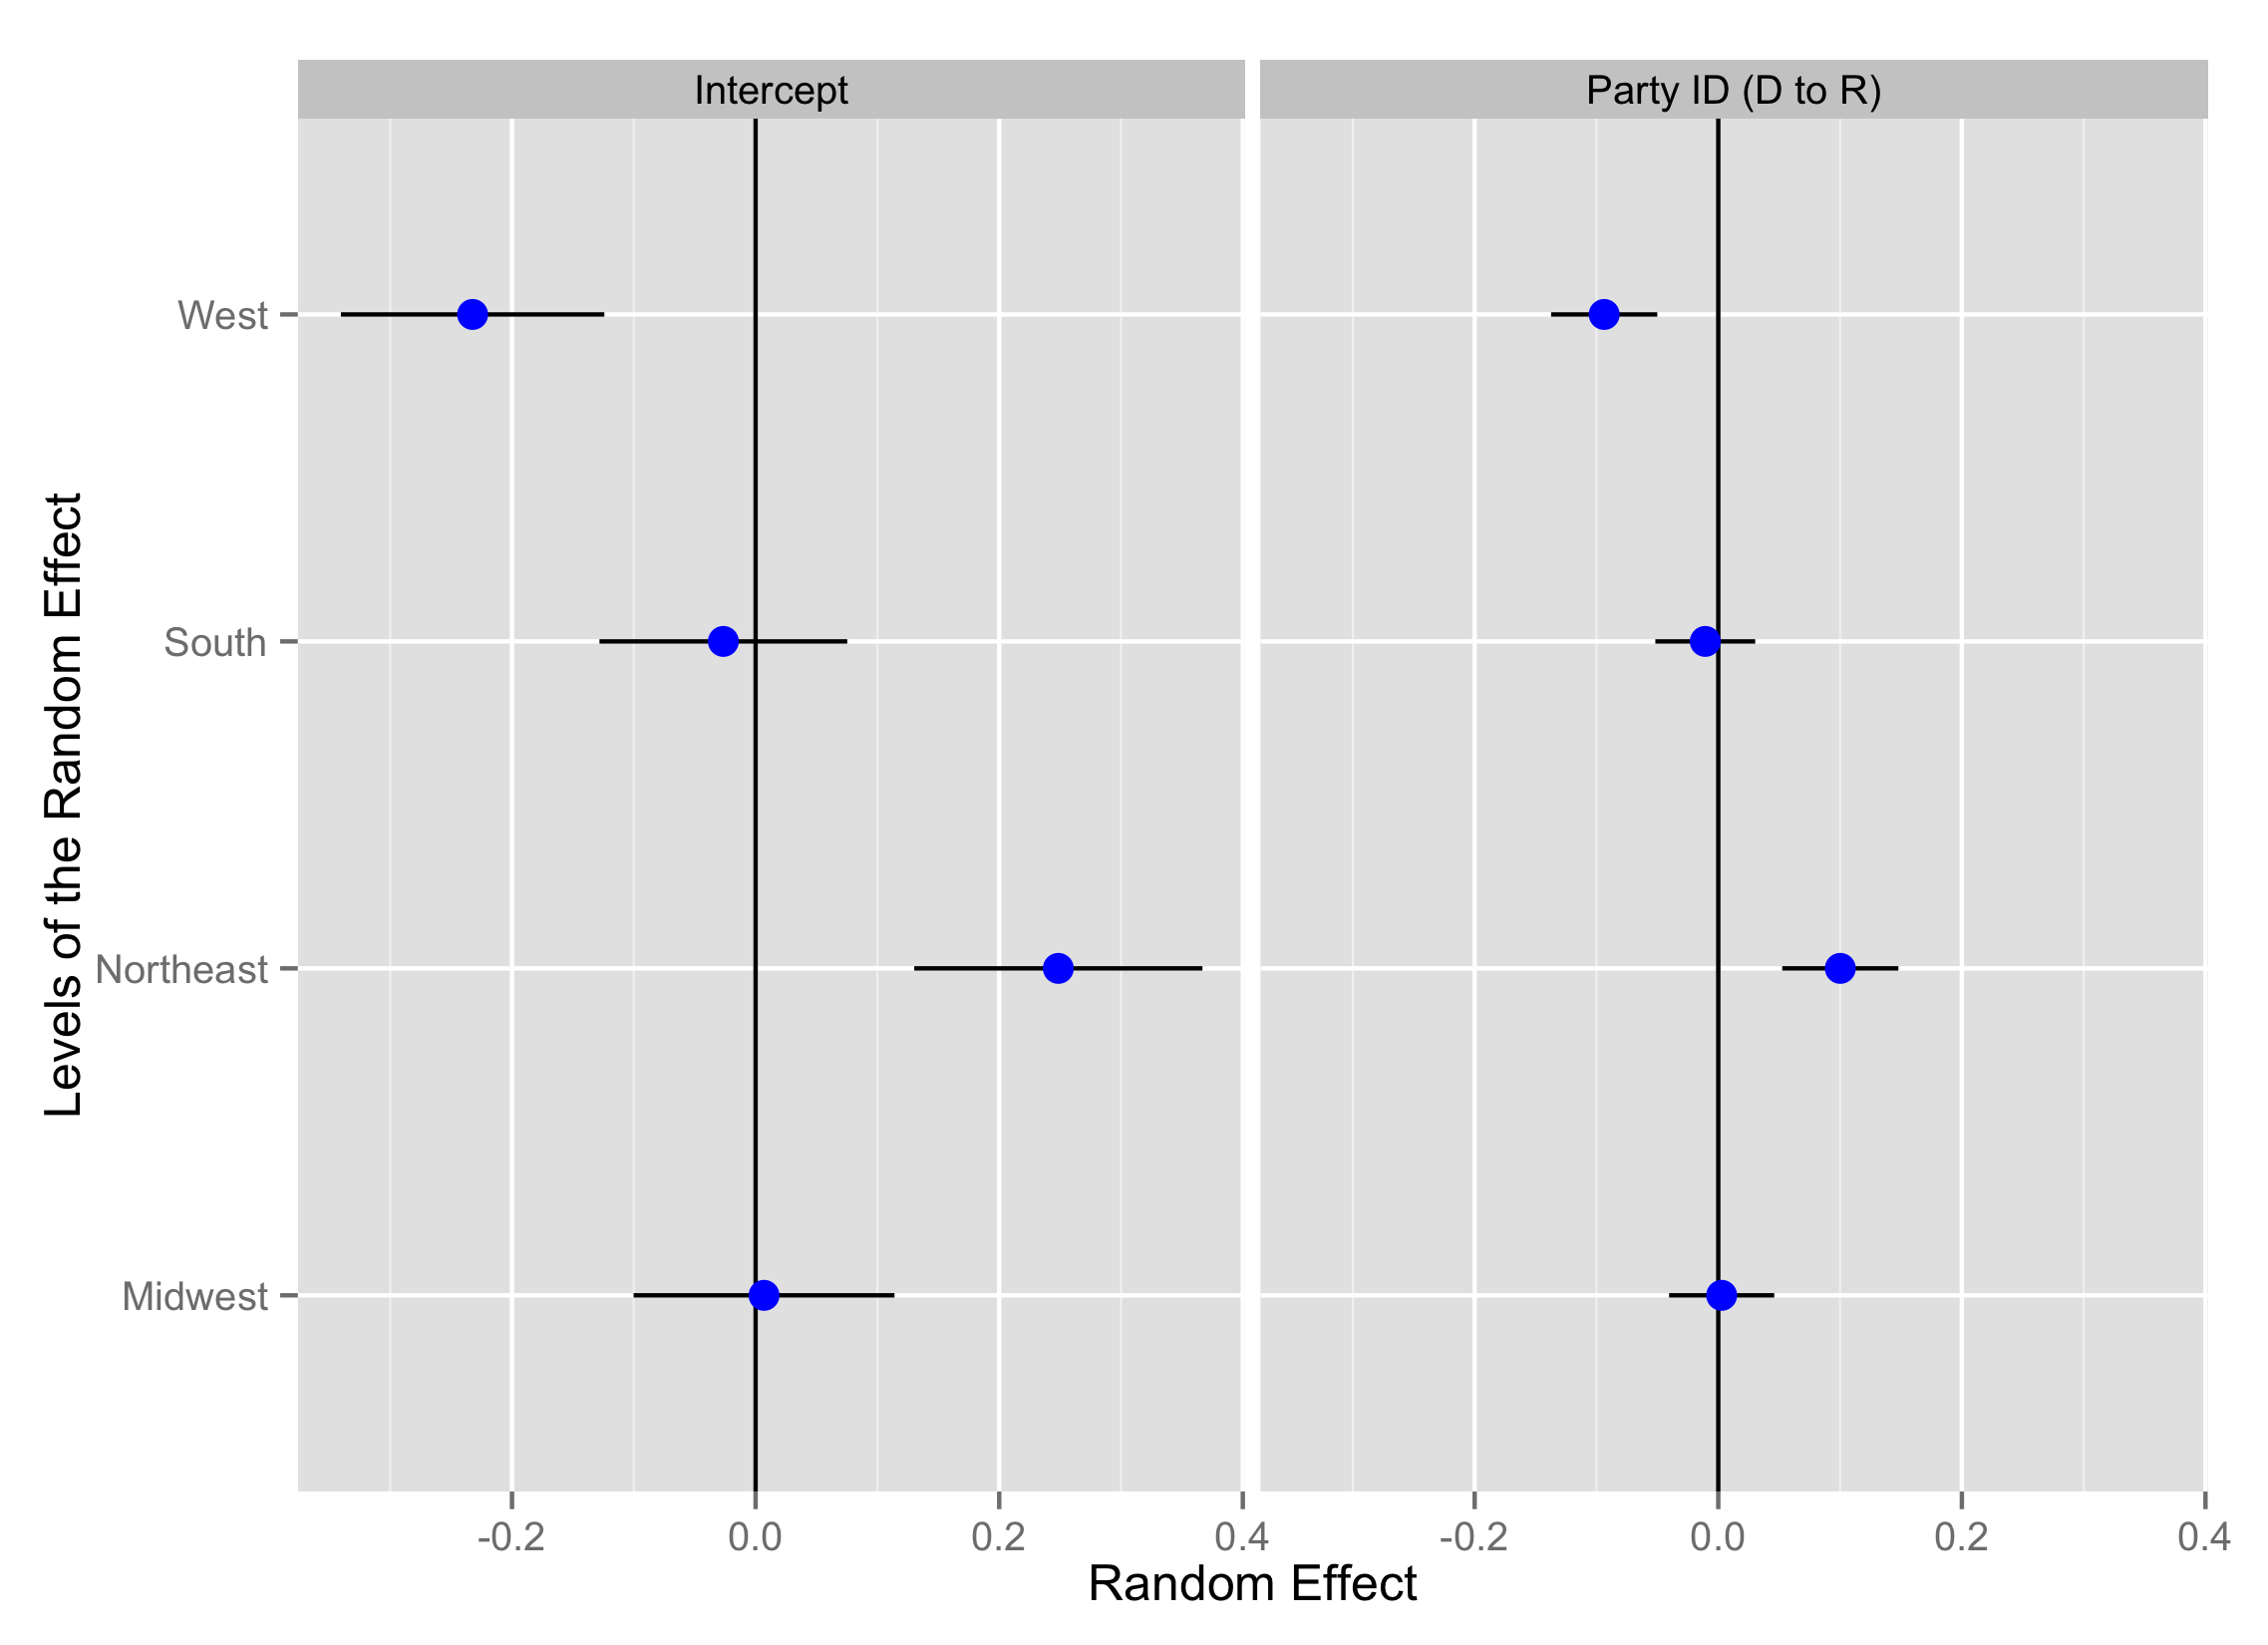
- A caterpillar plot of the random effects in Model 1 (support for police permits) with random intercept for region and random slope for party ID (1994-2014).
Conclusion
We commonly believe the gun control debate to be a polarizing issue. However, data from the General Social Survey suggest that is not necessarily true. GOP partisanship does not robustly reduce support for gun control across all forms of gun control policies that could be considered by the general public. Further, most Republicans actually support gun control measures notwithstanding the negative relationship between GOP partisanship and support for gun control. However, the issue is quickly becoming a polarizing issue among the electorate, and it’s likely not just the South that is responsible for that.
Code for this analysis is available on my Github.
-
The more accurate claim on polarization may be that the electorate is not more “polarized”, just that the relationship between ideology and party affiliation is stronger now than it was before the great “sorting” through the 1970s and 1980s, arguably culminating in the “Republican Revolution” of 1994. Per Morris Fiorina’s scholarship, the greater polarization appears to be among America’s ruling class and those non-politicians/bureaucrats still involved in the highest levels of politics. ↩
-
GSS regrettably stops coding age in years for respondents older than 89. In other words, a value of 89 indicates respondents 89 and older. This coding decision makes the variable as technically ordinal, though I will treat it as interval for convenience. ↩
-
I recode the 7s in this variable to be missing. These are respondents who have another party affiliation and do not disclose it. ↩
-
See King, Tomz, and Wittenberg’s (2000) famous paper on this topic. ↩
-
If either Gelman or Hill stumble across this post, I hope they know I would love to get an updated version of this book though I don’t think a second edition is in the work. Gelman, in particular, has since done great work with Stan. The ensuing book has largely incorporated those examples into this new framework. ↩
-
Respondents in the Northeast are much more likely to support police permits while the intercept for the Midwest is almost zero (i.e. the Midwest is indistinguishable from the global average). ↩
Disqus is great for comments/feedback but I had no idea it came with these gaudy ads.