How Bad America's Gun Violence/Mass Shooting Problem Is, Automated with R Code

- Artist Ignacio 'Nacho' Moya carries a sign he made during a vigil for the victims of the Gilroy Garlic Festival Shooting (Nhat V. Meyer/Bay Area News Group)
Last updated: 7 May 2022
Another day, another mass shooting for literally the only country of its size and development where this happens on a routine basis. This one in El Paso may (reportedly) have some domestic terrorist overtones to it, but barring confirmation of the shooter and the shooter’s motives for the moment(nevermind), this post will focus on just the gun violence and the mass shooting angle here.
Gun control emerged as a political and academic hobby horse of mine largely because the problem strikes me as a massive and obvious public health problem that has a fairly simple solution on paper. Cheap gun supply—especially of weapons like AR-15s and AK-47s that have no practical use for hobbyists, hunters, ranchers, or those with an earnest interest in self-defense—decreases the transaction costs associated with carrying out violent rampages (see: Wintemute, 2005 and Bartley and Williams, 2018). The quality of those assault rifles in particular also increases the costs for first-responders, putting them at risk and delaying much needed aid. This raises the societal costs for these “transactions” carried out by perpetrators. Restricting gun supply should raise the transaction costs associated with executing a violent rampage. Again, it’s not hard. If you don’t believe that, then you don’t believe people respond to economic incentives.
Obviously, there’s no political will here. The public opinion is there in support of most forms of gun control, even subtly aggressive forms of gun control, but GOP voters are gradually adopting cues from GOP elites on this topic. At the elite-level, the GOP relies on the National Rifle Association—which wants cheap guns for purchase to the benefit of gun manufacturers—to help message “conservatism” to the voting bloc and massage over other issues for GOP partisans (on fiscal policies, for example). The National Rifle Association is well-funded and partisan sorting has made them credible threats to primary GOP legislators who don’t cooperate with them.
Alas, here we are: massive public health problem—needless public health problem—fairly simple and straightforward policy proposals, and no real (collective) will to do them. 🤷
Anywho, a few lines of R code will emphasize the scope of the problem.
First, GunPolicy.org is an excellent repository of information about gun deaths, gun laws, and gun trafficking for a slew of countries over time. It also has fairly comprehensive coverage of estimated gun homicides per 100,000 people that leans on country reports from various agencies (e.g. Center for Disease Control, United Nations Office on Drugs and Crime, World Health Organization) and incorporates information from academic research on gun homicides as well when necessary. Since we’re dealing with advanced countries, there is high confidence in the estimates even if not all years are covered (e.g. the latest year for Germany in the data is 2015).
I gathered data for 25 peer countries to the U.S. (i.e. Western Europe, Northern Europe, Canada, Australia, and New Zealand) in addition to data for the U.S. on gun homicides per 100,000 people in the population. I created a data frame for it (ghp100k) and added it to my {stevedata} package.. You can read more about the data here and, better yet, check the underlying sources here.
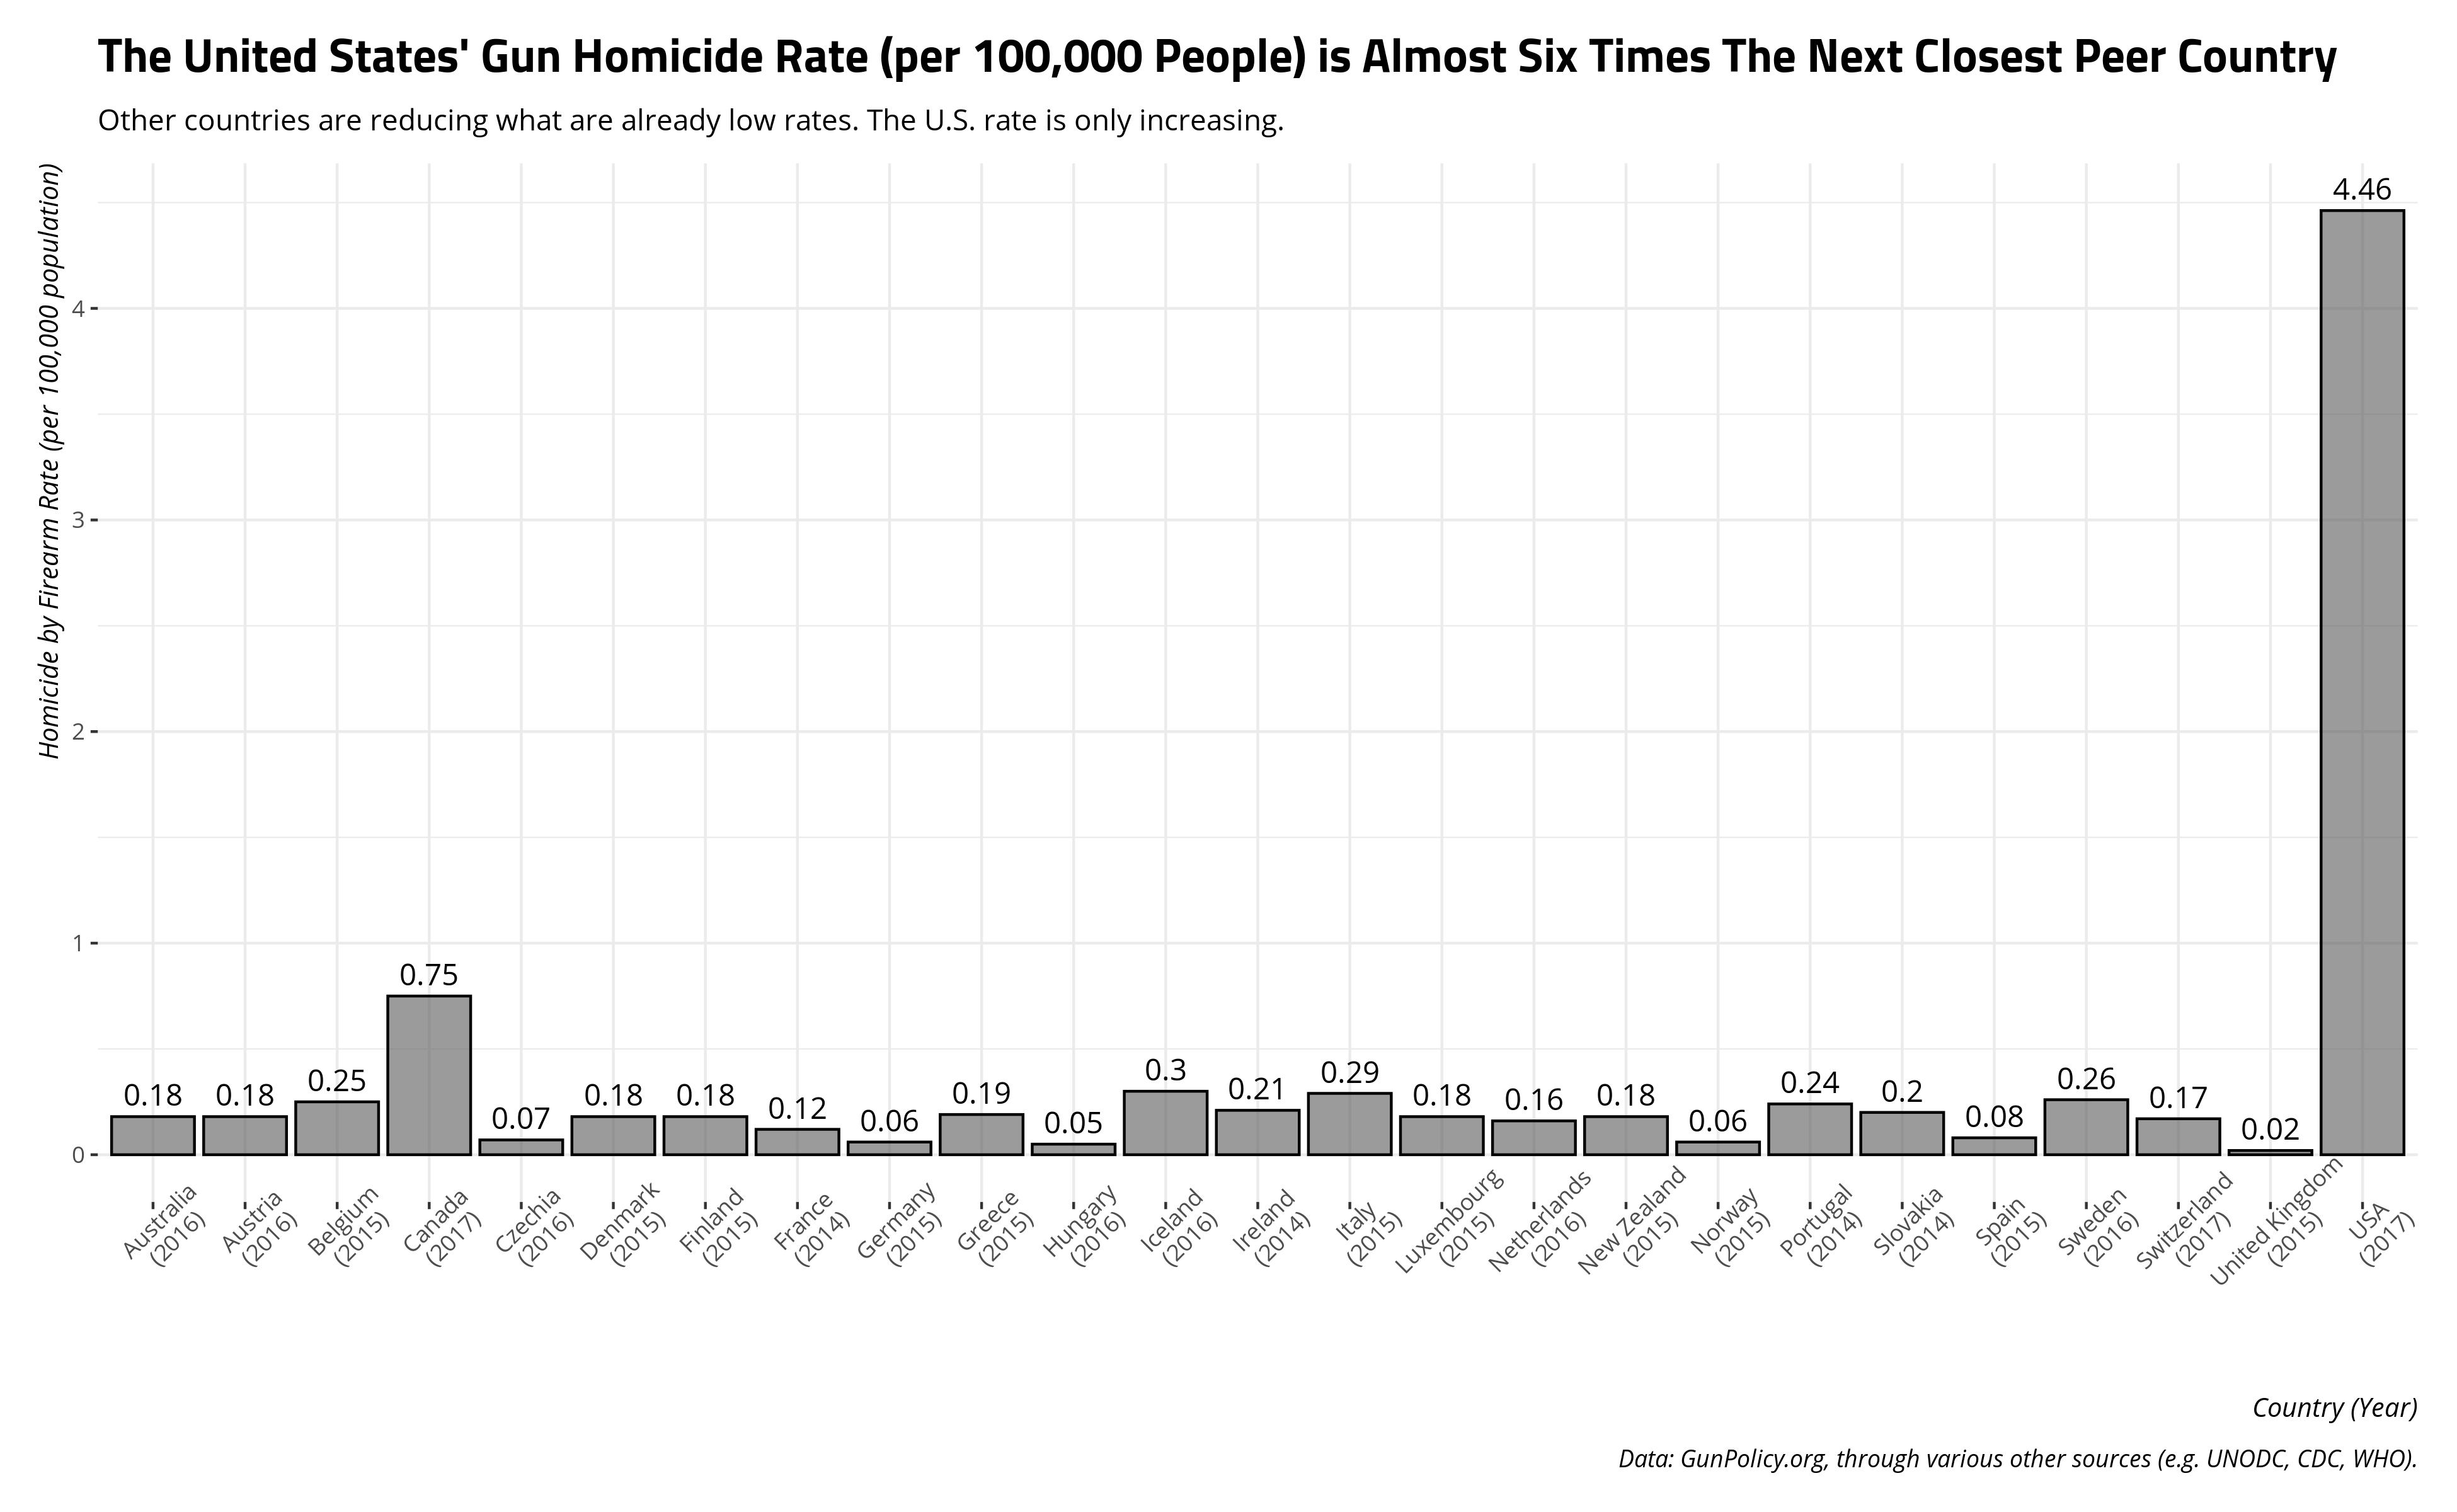
We can first assess the scope of the problem by selecting on the latest years for all 25 countres in the data. Here, it’s apparent the U.S. will conspicuously be an island among peer countries for its gun homicide rate. The U.S. had a gun homicide rate (per 100,000 people) in 2017 of an astounding 4.46. The next closest country is Canada, with a rate .75. The U.S. rate is almost six times the next closest country in gun homicides.
# require(tidyverse)
# require(stevedata)
# data(ghp100k)

ghp100k %>%
  arrange(country, year) %>%
  group_by(country) %>%
  slice(n()) %>%
  mutate(cy = paste0(country,"\n(", year, ")"),
         cy = fct_lump(cy, value)) %>%
  ggplot(.,aes(cy, value)) +
  theme_steve_web() +
  geom_bar(stat="identity", alpha=0.6, color="black") +
  geom_text(aes(label=round(value, 2)), vjust=-.5, colour="black",
            position=position_dodge(.9), size=4, family="Open Sans") +
  theme(axis.text.x = element_text(angle = 45)) +
  labs(x = "Country (Year)",
       y = "Homicide by Firearm Rate (per 100,000 population)",
       caption = "Data: GunPolicy.org, through various other sources (e.g. UNODC, CDC, WHO).",
       title = "The United States' Gun Homicide Rate (per 100,000 People) is Almost Six Times The Next Closest Peer Country",
       subtitle = "Other countries are reducing what are already low rates. The U.S. rate is only increasing.")
In the event someone may want to copy-paste this information in lieu of showing this graph, you can see the pertinent information here.
| Country | Year (Most Recent) | Homicide by Firearm Rate (per 100,000 People) |
|---|---|---|
| USA | 2017 | 4.46 |
| Canada | 2017 | 0.75 |
| Iceland | 2016 | 0.30 |
| Italy | 2015 | 0.29 |
| Sweden | 2016 | 0.26 |
| Belgium | 2015 | 0.25 |
| Portugal | 2014 | 0.24 |
| Ireland | 2014 | 0.21 |
| Slovakia | 2014 | 0.20 |
| Greece | 2015 | 0.19 |
| Australia | 2016 | 0.18 |
| Austria | 2016 | 0.18 |
| Denmark | 2015 | 0.18 |
| Finland | 2015 | 0.18 |
| Luxembourg | 2015 | 0.18 |
| New Zealand | 2015 | 0.18 |
| Switzerland | 2017 | 0.17 |
| Netherlands | 2016 | 0.16 |
| France | 2014 | 0.12 |
| Spain | 2015 | 0.08 |
| Czechia | 2016 | 0.07 |
| Germany | 2015 | 0.06 |
| Norway | 2015 | 0.06 |
| Hungary | 2016 | 0.05 |
| United Kingdom | 2015 | 0.02 |
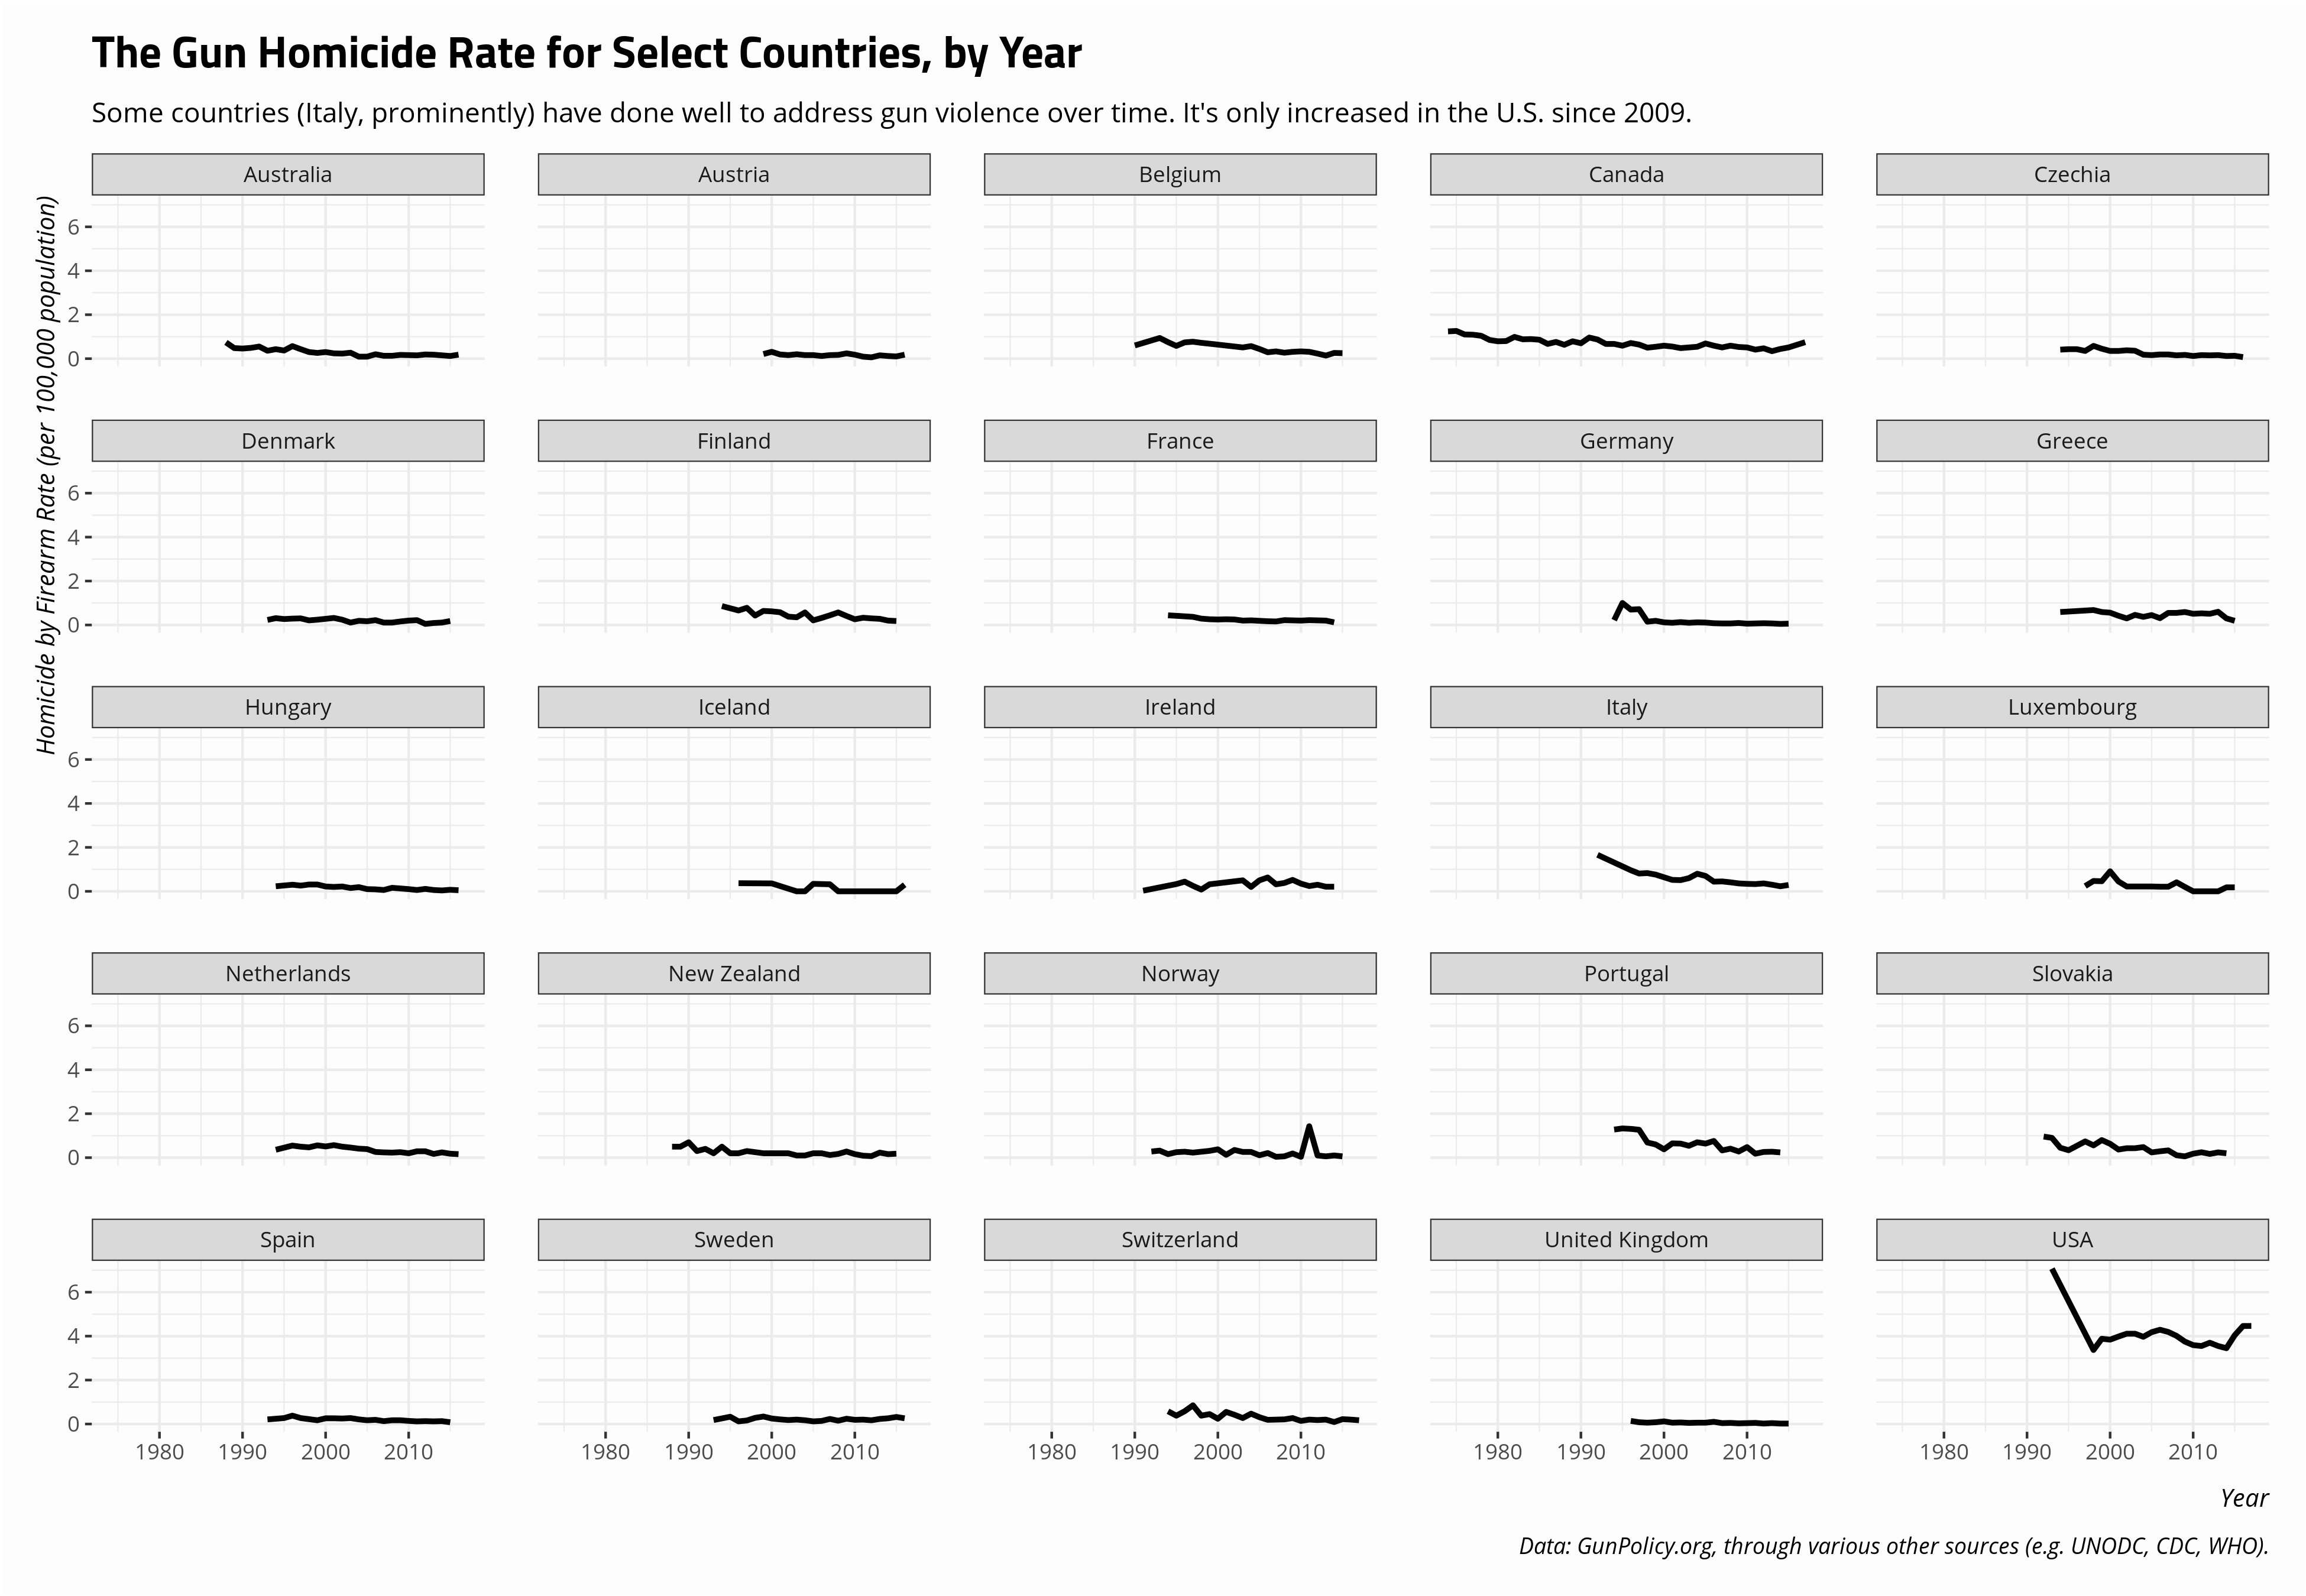
The data I collected have a time-series component as well to assess changes over time. A few things are worth highlighting here. First, data availability isn’t as great for the 1990s since GunPolicy.org leans heavily on the Centers for Disease Control to get estimates for homicide rates by firearm. The Wonder tool has an easy API for data from 1999 to 2017, which would explain why that’s the bulk of the data here, in addition to that lonely observation from 1993. Second, the U.S. gun homicide rate had been much worse a few decades ago. This we knew. Crime rates everywhere in the United States were higher a few decades ago than they are now. Still, the gun homicide rate is increasing in the United States since 2009.
| Country | Year | Homicide by Firearm Rate (per 100,000 People) |
|---|---|---|
| USA | 1993 | 7.07 |
| USA | 1998 | 3.37 |
| USA | 1999 | 3.88 |
| USA | 2000 | 3.84 |
| USA | 2001 | 3.98 |
| USA | 2002 | 4.11 |
| USA | 2003 | 4.11 |
| USA | 2004 | 3.97 |
| USA | 2005 | 4.18 |
| USA | 2006 | 4.29 |
| USA | 2007 | 4.19 |
| USA | 2008 | 4.01 |
| USA | 2009 | 3.75 |
| USA | 2010 | 3.59 |
| USA | 2011 | 3.55 |
| USA | 2012 | 3.70 |
| USA | 2013 | 3.55 |
| USA | 2014 | 3.45 |
| USA | 2015 | 4.04 |
| USA | 2016 | 4.46 |
| USA | 2017 | 4.46 |
By comparison, they’re improving in every other country, prominently Italy.
ghp100k %>%
  arrange(country, year) %>%
  ggplot(.,aes(year, value)) + geom_line(size=1.1) +
  theme_steve_web() +
  post_bg() +
  facet_wrap(~country) +
  labs(title = "The Gun Homicide Rate for Select Countries, by Year",
       x = "Year",
       y = "Homicide by Firearm Rate (per 100,000 population)",
       subtitle = "Some countries (Italy, prominently) have done well to address gun violence over time. It's only increased in the U.S. since 2009.",
       caption = "Data: GunPolicy.org, through various other sources (e.g. UNODC, CDC, WHO).")
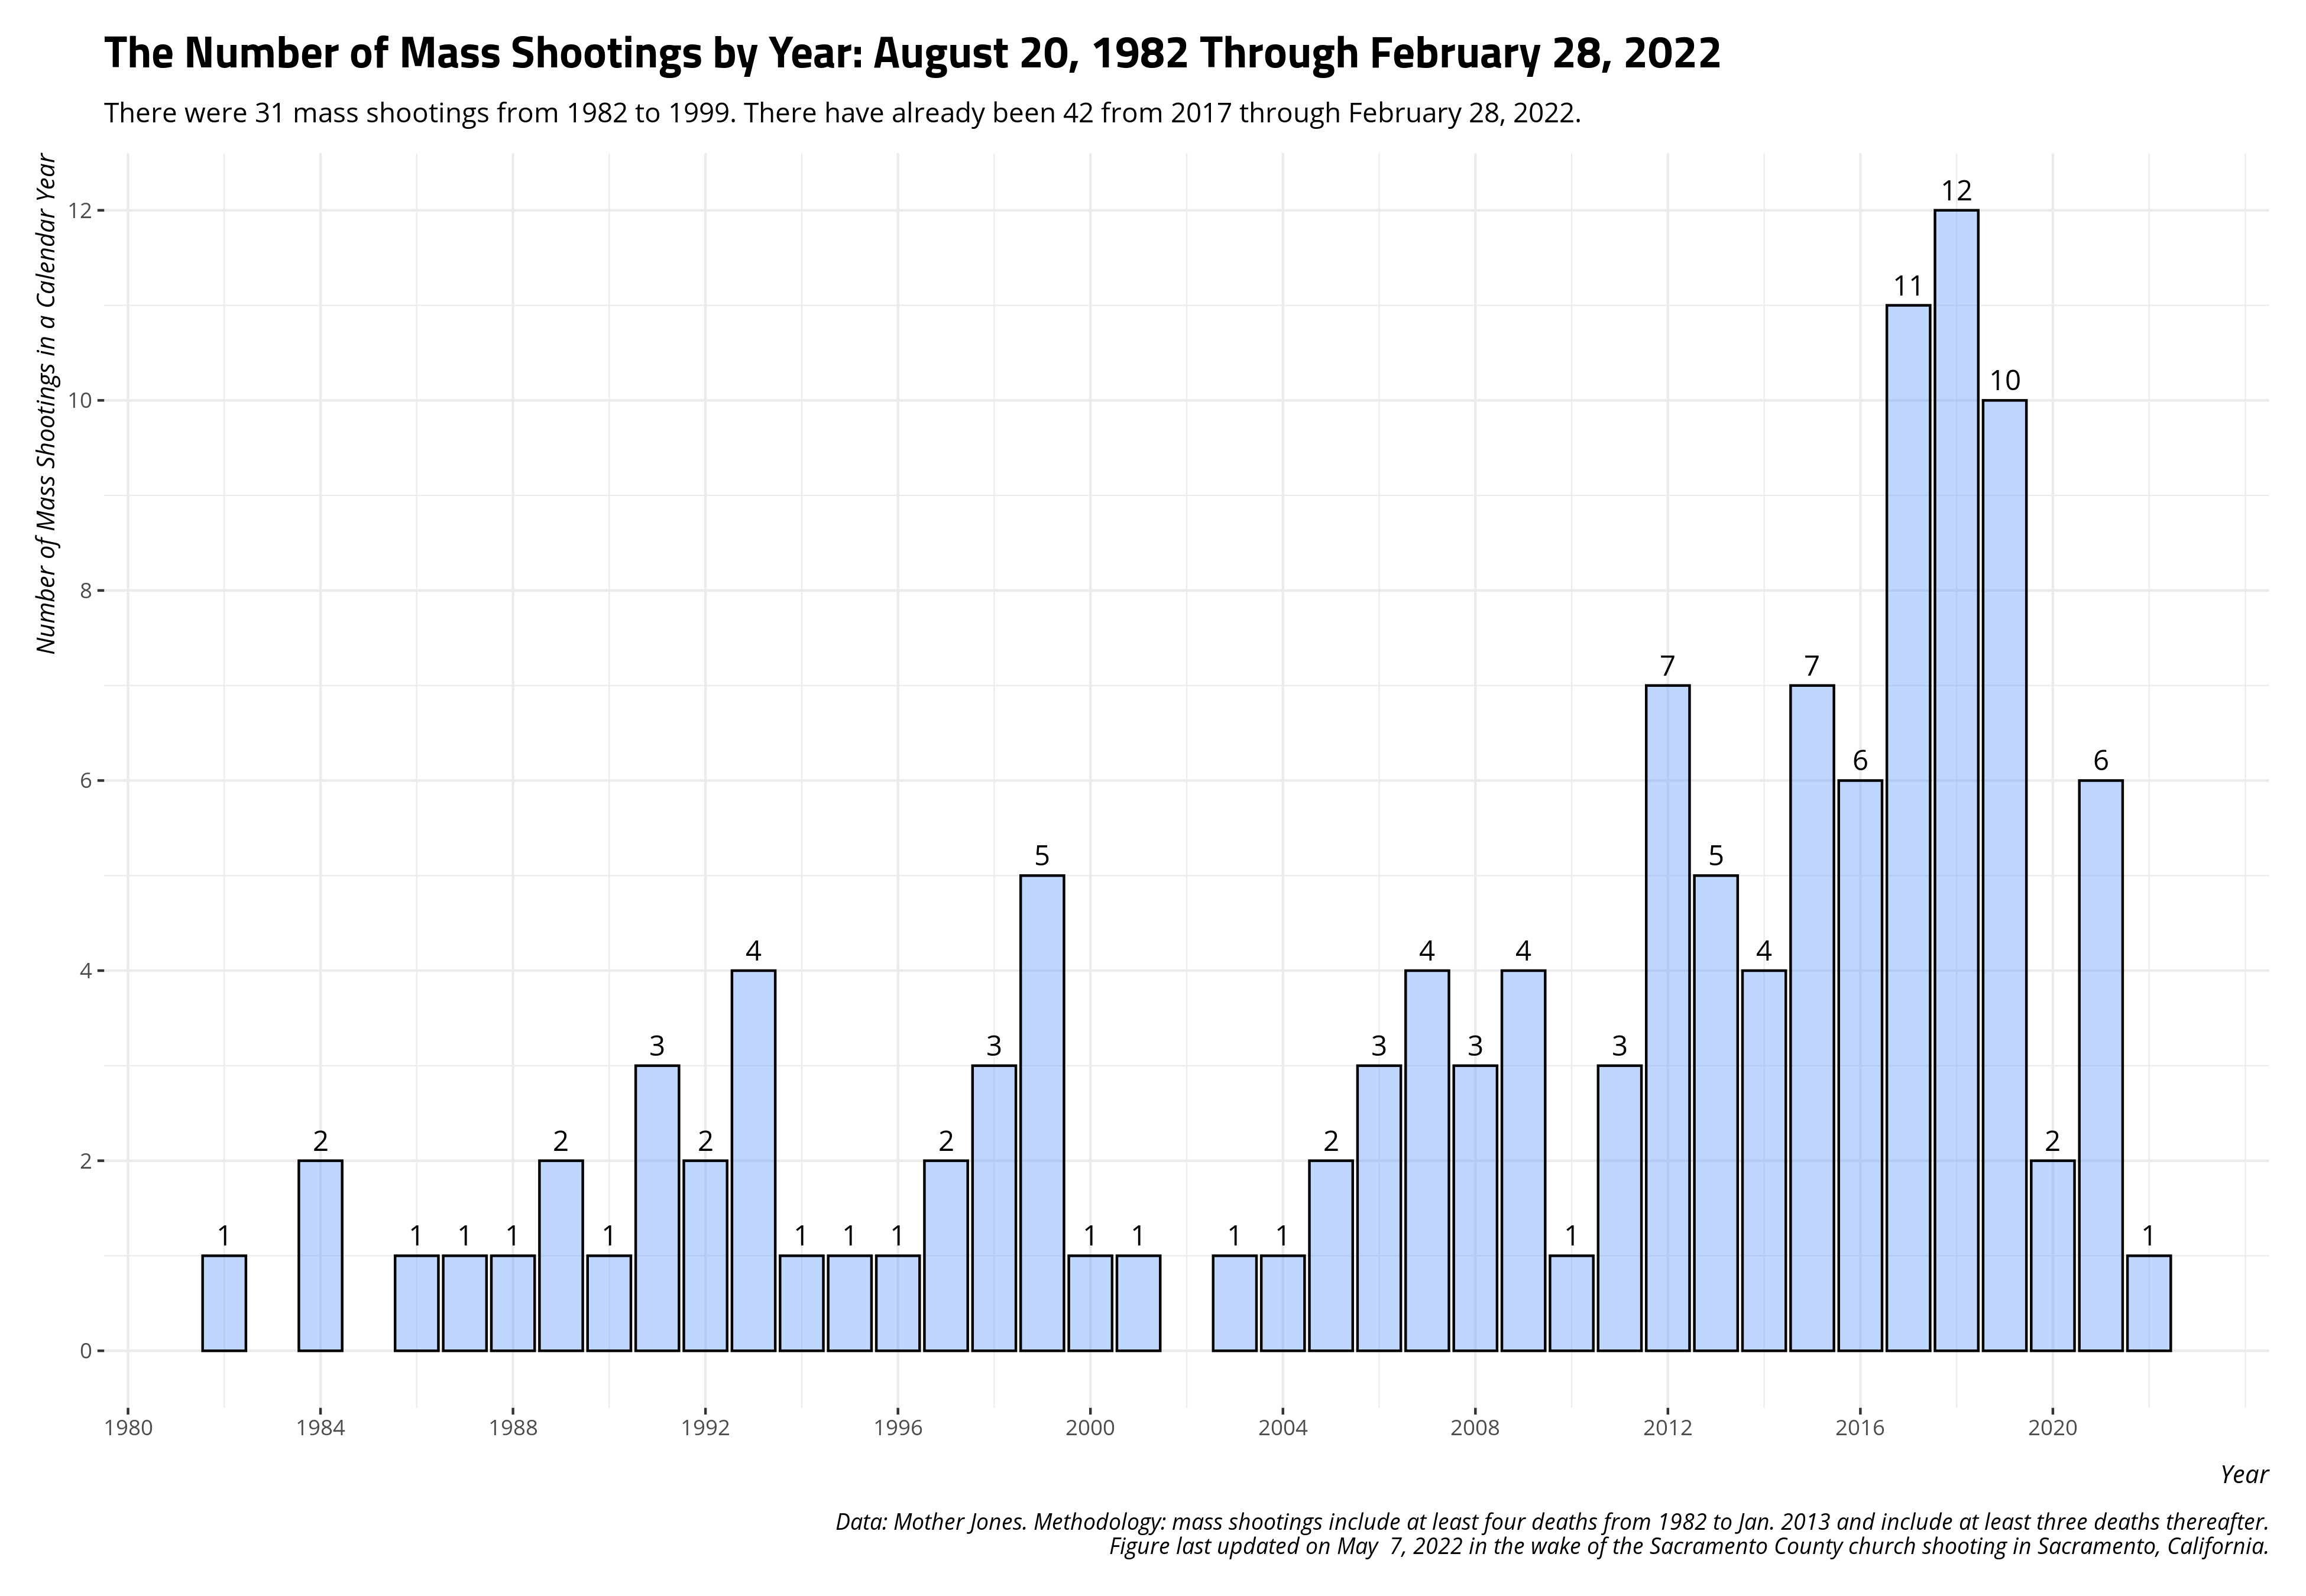
Finally, you can start thinking about automating a script to scan the Mother Jones database on mass shootings to note how this problem is only getting worse. In subsequent updates, I might try to fully automate this with built-in assessments of how much worse the problem is getting.
Because it’s only getting worse.
library(gsheet)

gsheet2tbl('https://docs.google.com/spreadsheets/d/1b9o6uDO18sLxBqPwl_Gh9bnhW-ev_dABH83M5Vb5L8o/htmlview?sle=true#gid=0') %>%
  separate(date, c("month","day","year"), sep="/") %>%
  mutate(date = lubridate::as_date(paste0(year,"-",month,"-", day))) %>%
  select(case, date, everything()) -> mass_shootings

mass_shootings %>%
  slice(1) %>%
  select(date) %>%
  mutate(date = format(date, '%B %d, %Y')) %>%
  pull(date) -> last_update

mass_shootings %>%
  slice(1) %>%
  pull(case) -> most_recent_case

mass_shootings %>%
  slice(1) %>%
  pull(location) -> most_recent_location

mass_shootings %>%
  slice(n()) %>%
  select(date) %>%
  mutate(date = format(date, '%B %d, %Y')) %>%
  pull(date) -> first_event

mass_shootings %>%
  mutate(year = lubridate::year(date)) %>%
  group_by(year) %>%
  summarize(n = n()) -> mass_shootings_yearly

mass_shootings_yearly %>%
  filter(year <= 1999) %>%
  summarize(n = sum(n)) %>% pull(n) -> nobs80s90s

mass_shootings_yearly %>%
  filter(year >= 2017) %>%
  summarize(n = sum(n)) %>% pull(n) -> nobssince2017

today <- format(Sys.time(), '%B %e, %Y')

mjms_title = paste0("The Number of Mass Shootings by Year: ", first_event, " Through ", last_update)
mjms_subtitle = paste0("There were ", nobs80s90s, " mass shootings from 1982 to 1999. There have already been ", nobssince2017, " from 2017 through ", last_update,".")
mjms_caption = paste0("Data: Mother Jones. Methodology: mass shootings include at least four deaths from 1982 to Jan. 2013 and include at least three deaths thereafter.\nFigure last updated on ", today, " in the wake of the ", most_recent_case," in ",most_recent_location,".")

mass_shootings_yearly %>%
  ggplot(.,aes(year, n)) +
  theme_steve_web() +
  geom_bar(stat="identity", alpha=0.4, fill="#619cff",color="black") +
  scale_x_continuous(breaks = seq(1980, 2020, by = 4)) +
  scale_y_continuous(breaks = seq(0, 14, by =2)) +
  geom_text(aes(label=n), vjust=-.5, colour="black",
            position=position_dodge(.9), size=4, family="Open Sans") +
  labs(y = "Number of Mass Shootings in a Calendar Year",
       x = "Year",
       title = mjms_title,
       subtitle =  mjms_subtitle,
       caption = mjms_caption)
Disqus is great for comments/feedback but I had no idea it came with these gaudy ads.