Data Science for the Social Sciences
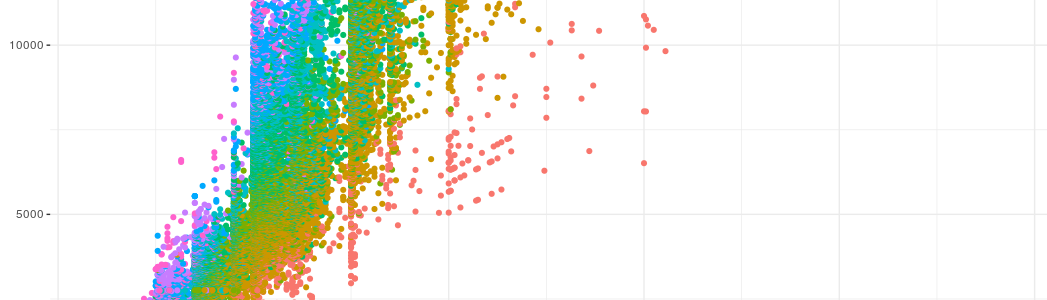
- Canonical scatterplot of diamond carat and diamond price.
University instruction privileges an emphasis on “statistics” to improve students’ quantitative skills, but increasingly key decision-makers in the private and public sphere care less about the minutiae of random sampling and experimental design and more about the collection, analysis, and presentation of data. We call this an increasing demand for “data science,” which we will distinguish from a normal academic track of statistics for its emphasis on data collection, data munging or “tidying,” data modeling, and presentation. We will start first with the data collection process, covering topics of workflow, data input/output, and gathering/visualizing different types of data. The next module will concern how to model data, for which topics will cover more than simple regression. We will close with how to present data using tools like R Markdown and ggplot2. Students who complete this class should acquire a broad array of tools that would make them attractive candidates for jobs that require these skills in both the private sector and government.