Outgroup Intolerance and Support for Democracy: An Analysis of White Americans in the World Values Survey Data
This Blog Post is Now a Peer-Reviewed Paper ⤵️
I thank Nicholas T. Davis for joining this project via open call on Twitter. Together, we published this in Journal of Race, Ethnicity, and Politics. The analysis here is 95% the same; I think I changed how I handled NAs in the emancipative values variable. That's it. The framing changed as reviewers ultimately wanted it more about the more immediately measurable concept of "prejudice" rather than antecedent conditions like "intolerance." It's big case of six-of-one for the substantive takeaways.
Suggested Citation:
Miller, Steven V. and Nicholas T. Davis. 2021. "The Effect of White Social Prejudice on Support for American Democracy." Journal of Race, Ethnicity, and Politics. 6(2): 334--351.
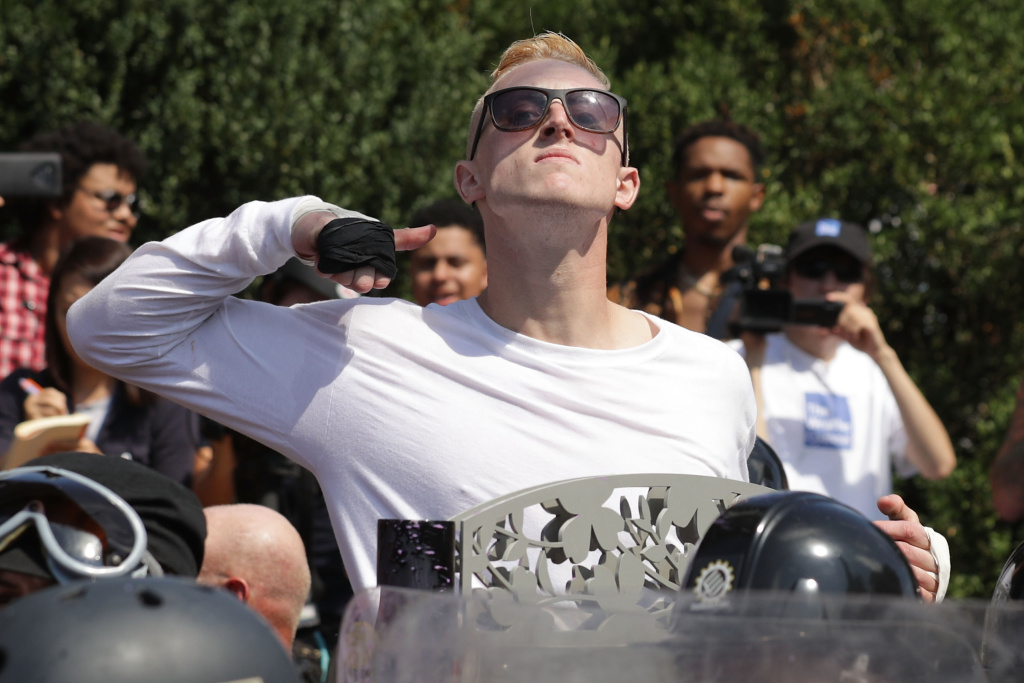
- A man marching with white nationalists makes a slashing motion across his throat toward counter-protester in Charlottesville's white pride rally. (Chip Somodevilla/Getty Images)
Last weekend’s events in Charlottesville, Virginia, along with the ongoing reaction from President Trump and complicit acceptance of these developments by Republican leadership, suggest a troubling trend emerging in American politics. Racism has always been a fact of life in American politics. It’s also been a recurring theme of Republican politics for the past 50 years (e.g. Nixon’s “law and order,” Reagan’s “welfare queen,” Bush’s Horton ad) despite the Chair of the Republican National Committee trying to pretend racism hasn’t been an important calling card for the GOP.
Racism has always been a fact of American politics, and perhaps no candidate had ever raised subtext to text like Trump. My worries run deeper than that. Watch the Vice documentary on Charlottesville where these white supremacists advertise they want to fight and subvert the public order. Look at the photos of the white supremacists and their supporters armed to the teeth and, per Virginia’s governor, effectively outflanking the police (i.e. the monopoly on the legitimate use of force in this context, per Max Weber). Think of the racial overtones in defense of a slave-holding secessionist regime that fought a war against the United States. Trump’s press conference at his residence and subsequent Twitter tantrums seem to suggest a tenuous commitment to democratic principles for those 1) taking part in these protests and 2) supporting these rallies/intimidation measures.
Four waves of World Values Survey (WVS) data from 1995 to 2011 largely support that. White respondents in the United States over those four waves who expressed that they would not like to have various outgroups of interest as neighbors (i.e. those from a different race, Muslims, immigrants/foreign workers, Jews, and those speaking a different language) were more likely to support rule of government by a strong leader without legislative or electoral oversight, rule of government by the army, and were more likely to oppose democracy, in general. I detail the method and the analysis below.
The Data
I use the aforementioned four waves of WVS data for this analysis and pattern the analysis off what I did in last year’s post about how Trump is picking up on what I termed a “strong leader problem” in the U.S.. Much of that analysis became this article now in print at Political Behavior.
Briefly, I take various general questions about attitudes toward democracy for Americans readily available in the WVS and regress them on some variables of interest. These dependent variables are four-item measures about whether the responsdent would think having a strong leader without legislative or electoral oversight or rule of government by the army would be good for the United States. I also include whether the respondent believes having a democracy would be good for the United States. I condense these four-item measures to equal 1 if the respondent thinks a strong leader or army rule would be good and if having democracy would be bad. I invert the scale of the democracy question for comparability of coefficients.
I simplify the set of regressors to variables for age, age-squared, whether the respondent is a woman, whether the respondent has a high school education or less, the respondent’s ideology, ideology-squared, an income scale measuring personal income, whether the respondent identifies as a Republican or Democrat relative to a baseline of independents or third-party supporters (e.g. Libertarians, Reform Party [remember them?]), whether the respondent is unemployed, and the emancipative values measure from Welzel.
I offer one new variable here to measure white intolerance for various outgroups that routinely appear as pejoratives for the white supremacists like we saw in Charlottesville. The WVS is not perfect for these questions. Indeed, eliciting a xenophobic or racist statement in a survey or survey experiment is hard (see: my summary of what Christopher DeSante and Candis Smith are doing) and typically require more nuance than WVS shows (e.g. endorsement experiments). Still, WVS uses something close to a familiar device for intolerance researchers. The survey asks respondents to say what types of people they would not like to have as neighbors.1 The respondent can name any they like from a set list of familiar groups.
This question has evolved over time and is generalizable to different countries and contexts in WVS. Available responses in the U.S. include:
- Criminals
- Members of a different race
- Heavy drinkers
- Emotionally unstable people
- Muslims
- Immigrants/foreign workers
- People with AIDS
- Drug addicts
- Homosexuals
- Jews
- People of a different religion
- People of the same religion
- “Militant minority”
- Political extremists
- Unmarried couples living together
- People who speak a different language
There is substantial variety in this question. There are also a few “easy” targets here, like criminals, heavy drinkers, and drug addicts. While I’m sure these items have important subtext to which a respondent might react (e.g. “criminals”), they’re banal without it. Indeed, most respondents selected these groups of all the available options because they probably make crummy neighbors.
I’m most interested in those who say that they would not want members of a different race, Muslims, immigrants/foreign workers, Jews, and those who speak a different language as neighbors. White supremacists/nationalists and nativists routinely single out these groups in one form or another, with varying levels of subtext. I code a dummy that equals 1 if a respondent identified any one of those as an unwelcome neighbor.2
Unlike last year’s post on the strong leader problem, I subset the data to just white respondents. The models that follow are mixed effects logistic models with random effects for the condensed Census region, the year of the survey, and the Census-year (e.g. “South-1995”, “Northeast-2011”).
The Results
The three regressions I summarize in Table 1 all suggest a positive effect of white intolerance toward these outgroups on a general opposition to democracy. Respondents who would not want members of a different race, Muslims, immigrants/foreign workers, Jews, and those who speak a different language as neighbors were more likely to want rule of government by a strong leader, the army, or were more likely to oppose democracy relative to respondents who did not signal an opposition to any of these outgroups as neighbors (i.e. those who would not want criminals or unmarried couples instead).
Interestingly, the only other effect that is positive and robust across all three models is the education variable. Those with a high school education or less were more likely to want a strong leader or the army to rule the government. They were also more likely to oppose democracy as a political system for the United States.
| Dependent variable: | |||
| Strong Leader | Army Rule | Opposition to Democracy | |
| (1) | (2) | (3) | |
| Age | -0.449*** | -0.452*** | -0.612*** |
| (0.088) | (0.077) | (0.121) | |
| Age-squared | 0.163 | 0.049 | 0.099 |
| (0.160) | (0.140) | (0.226) | |
| Female | 0.057 | 0.142** | 0.522*** |
| (0.084) | (0.072) | (0.118) | |
| High School Education or Less | 0.587*** | 0.204** | 0.572*** |
| (0.099) | (0.083) | (0.143) | |
| Ideology (L to R) | 0.006 | -0.164** | -0.274** |
| (0.102) | (0.082) | (0.139) | |
| Ideology-squared | -0.536*** | -0.264*** | -0.165 |
| (0.132) | (0.102) | (0.175) | |
| Income Scale | 0.022 | -0.008 | -0.503*** |
| (0.093) | (0.079) | (0.130) | |
| Republican | -0.399*** | -0.213* | -0.266* |
| (0.131) | (0.116) | (0.161) | |
| Democrat | -0.090 | -0.081 | -1.627*** |
| (0.125) | (0.111) | (0.189) | |
| Unemployed | 0.457** | 0.051 | 0.566** |
| (0.189) | (0.176) | (0.241) | |
| Emancipative Values | -0.614*** | 0.037 | -0.692*** |
| (0.096) | (0.081) | (0.136) | |
| White Outgroup Intolerance | 0.466*** | 0.310*** | 0.394*** |
| (0.098) | (0.089) | (0.133) | |
| Observations | 3,425 | 3,406 | 3,394 |
| Note: | *p<0.1; **p<0.05; ***p<0.01 | ||
| Models include random effects for Census region, year, and Census-years. | |||
I next offer some quantities of interest to illustrate the effect that outgroup intolerance has on white Republican men in their attitudes toward democracy in these models. I take draws from a multivariate normal distribution of the model and isolate values for white, employed Republican men of average age and ideology. The outgroup intolerance measure and education variable are all that change in simulating these model outcomes.
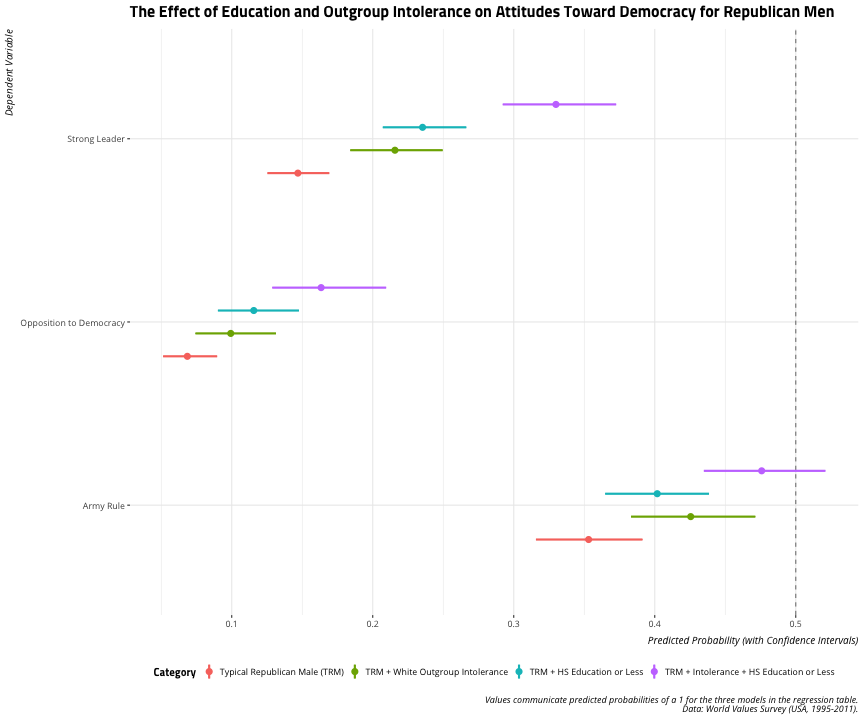
The results show the positive effect these attributes have on what amount to negative evaluations of democracy. Look at the simulations for the strong leader question. The typical Republican male in the model has a simulated probability around .148 of supporting a strong leader who does not have to bother with legislative or electoral oversight. The effect of either outgroup intolerance or lower levels of education constitute major changes in the simulated probability of supporting a strong leader that we can discern from the typical Republican male baseline. For example, the upper bound for the typical Republican male for supporting a strong leader is .171 while the lower bound for supporting a strong leader for a Republican male that does not want members of a different race, Muslims, immigrants/foreign workers, Jews, and those who speak a different language as neighbors is .218. Republican men with a high school education or less and who do not want these various outgroups as neighbors have a simulated probability of .332 of supporting a strong leader. This is almost a 125% change from the baseline simulated probability.
There are similar effects in the other models. The confidence intervals overlap of outgroup intolerance overlap with the baseline for typical Republican male in opposition to democracy and in support for army rule of the government. However, the two treatments combined—lower levels of education and outgroup intolerance—constitute magnitude changes from the baseline in opposing democracy and supporting rule of government by the army.
Conclusion
I worry that what we see in Charlottesville and the response to it by Republican leadership is more than just the festering of racism in American politics and its cynical use for votes in elections. Racism has been a recurring feature of American politics, certainly GOP politics for the past 50 years. Combined with the corollary issue of slavery, they constitute America’s original sin. However, I worry that Nazis and white supremacists feeling emboldened to make demonstrations against the public order signal more than just ugly racism. These groups may feel emboldened to communicate their tenuous commitment to American democracy as we’ve seen it evolve (however imperfectly) since the Civil War.
Consider the results here obviously illustrative. I could flesh it out more and focus the discussion more generally but I would need to know if I could get a publication of it for something more rigorous. For the time being, let this underscore a plea I made in my last analysis of how not-serious Americans are about democracy. We’re in a period of American politics where people—certainly partisans—may be supporting democracy the extent to which it produces winners they like. Yet, something more sinister may be happening on the right, especially the far right of the political spectrum where white supremacists and Nazis dwell. Their demonstrations, emboldened and effectively endorsed by Trump, in defense of a secessionist regime that fought the United States to expand slavery in the country signal a lukewarm acceptance of democracy as concept, certainly if democracy entails essential respect for minorities that Nazis and white supremacists consider persona non grata.
In other words, it’s time we as researchers start asking the hard questions about support for democracy in the United States we would otherwise ask in Pakistan or Venezuela.
-
I could just as well included “militant minority” but I have a few misgivings with this option. One, it’s loaded. I may not object to a “minority” as neighbor, but “militant?” Who wants that? Further, WVS provides no other documentation about what they mean here. ↩
Disqus is great for comments/feedback but I had no idea it came with these gaudy ads.