Fun with Attendance and Grades (i.e. Students Should Attend Class)
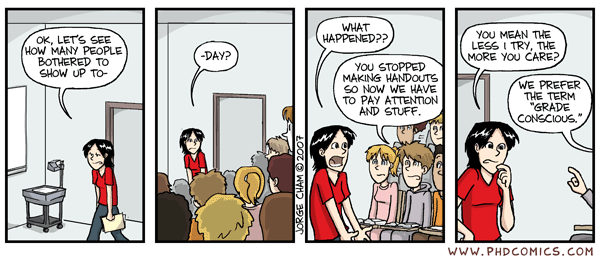
- I'll keep lectures slides available for now, but... (PHD Comics, naturally)
I started a two-year experiment in Fall 2014 to determine if there was a relationship between class attendance and overall grade in the class at the student-level. Surprise; there is.
I used to have a lax attendance policies when I taught classes as a graduate student at Alabama and a visiting lecturer at Illinois. It was convenient. Attendance was still relatively high. Those that came to class seemed to do well since I got to know who they were. Those that did not come to class did poorly, ostensibly because they missed valuable information from my lecture. This occurred when I would infrequently give written handouts from a lecture on my website whereas I now have lectures slides available from every class.
Long story short, forcing the issue of attendance seemed like paperwork with no real payoff. An enforced attendance policy in these classes would have been an inefficient use of my time.
This changed after my first year at Clemson. Students stopped coming to class corollary to my transition from infrequent written handouts to lecture slides I disseminate after every class. I started to force the issue of attendance and connect it to “participation” points (anywhere from 15-20% of the final grade) in the Fall of 2014. I also started to keep track of a discernible relationship that may exist between attendance and the overall grade for the course for students.
The reader will not be surprised to learn there is a robust positive relationship between the percentage of classes a student attends and the overall grade for the semester. I offer a series of models below to demonstrate this relationship though I will start with a basic description of the data.
The data here are fairly simple. I took attendance every class session for all 207 students in seven classes I taught from Fall 2014 to Spring 2016.1 Each student has a count of how many classes they attended, which is divided over the maximum number of classes in a given semester (minus exam days) and multiplied by 100. The maximum is 100 and the minimum is 0. This is the independent variable. The dependent variable is the percentage total grade for the semester, which again ranges from 0 to 100.
Here is a pretty graph to illustrate how robust the findings are with a basic linear regression of overall grade on percentage attendance in class. I am going to include this graph in every syllabus I have since it’s easy to include in R Markdown. The reader should know the R-square for this model is .549. A simple bivariate regression provides a good fit for the data.
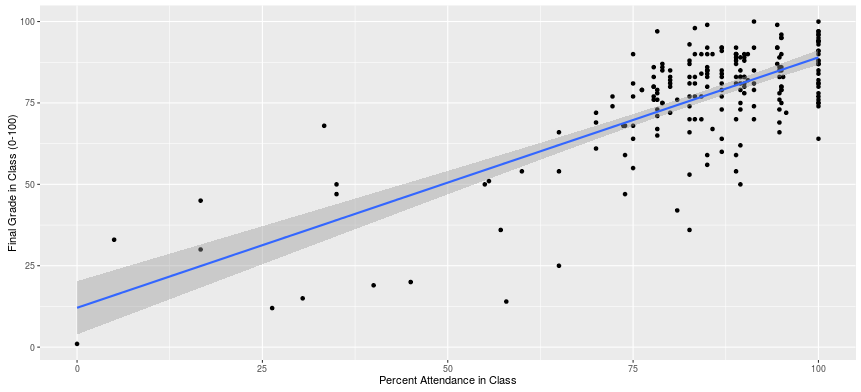
- A Scatterplot of the Relationship between Class Attendance and Final Grade (Fall 2014-Spring 2016)
Friends that know me also know I love to bombard with a series of models estimating a proposed relationship. So, I estimate the relationship between class attendance first as a linear model (Model 1). I estimate it again with fixed effects for semester and class number to control for unit heterogeneity (Model 2). Next, I estimate the model again with random effects for semester and class number (Model 3).
A smart student may object that attendance is partly endogenous to a grade since past classes deducted all participation points after five unexcused absences. This is true. So, I subset the data to just observations with greater than or equal to 75% attendance (i.e. roughly the threshold below which I deduct all participation points since one missed class constitutes a five-percent decrease in attendance). These analyses comprise Model 4, Model 5, and Model 6.
The reader can see that the results are robust to multiple model specifications and, well, an endogeneity concern.
| All Students | Attendance >= 75% | |||||
| Model 1 | Model 2 | Model 3 | Model 4 | Model 5 | Model 6 | |
| Percent Attendance in Class | 0.769*** | 0.798*** | 0.792*** | 0.441*** | 0.462*** | 0.455*** |
| (0.049) | (0.049) | (0.048) | (0.103) | (0.107) | (0.104) | |
| Model | OLS | Fixed Effects | Random Effects | OLS | Fixed Effects | Random Effects |
| N | 207 | 207 | 207 | 179 | 179 | 179 |
| ***p < .01; **p < .05; *p < .1 | ||||||
The student that sees this table should first consult my post on how to read a regression table and should think about these results in substantive terms. One missed class is about a five-percent decrease in percentage attendance for the semester. This means the results from Model 1 suggest that one missed class leads to an estimated decrease of 3.846 in the overall grade for the semester (i.e. .7692 * 5 = 3.846). This estimated effect is so precise that the t value is 15.795. The probability that there is no relationship given this parameter is basically zero.
Do note there is less precision when the data are subsetted to just attendance equal to or greater than 75%, but the t value associated with Model 4 is also far from zero (t = 4.265). Put another way, we would have observed this effect in my data if there were no true effect of attendance on grades about 3 times in 100,000 trials. That probability is effectively zero as well.
Students should attend class. My data and analyses suggest it would be worth the time for the grade-conscious student.
-
I did not take attendance for my Spring 2015 quantitative methods class because it had just five students. ↩
Disqus is great for comments/feedback but I had no idea it came with these gaudy ads.