Fixing Unnecessary Missingness in Democracy Scores in `{peacesciencer}`
Source:vignettes/democracy.Rmd
democracy.Rmd
library(tidyverse)
#> ── Attaching core tidyverse packages ──────────────────────── tidyverse 2.0.0 ──
#> ✔ dplyr     1.1.4     ✔ readr     2.1.4
#> ✔ forcats   1.0.0     ✔ stringr   1.5.0
#> ✔ ggplot2   3.5.1     ✔ tibble    3.3.0
#> ✔ lubridate 1.9.4     ✔ tidyr     1.3.0
#> ✔ purrr     1.1.0
#> ── Conflicts ────────────────────────────────────────── tidyverse_conflicts() ──
#> ✖ dplyr::filter() masks stats::filter()
#> ✖ dplyr::lag()    masks stats::lag()
#> ℹ Use the conflicted package (<http://conflicted.r-lib.org/>) to force all conflicts to become errors
library(peacesciencer)
#> The legacy packages maptools, rgdal, and rgeos, underpinning the sp package,
#> which was just loaded, will retire in October 2023.
#> Please refer to R-spatial evolution reports for details, especially
#> https://r-spatial.org/r/2023/05/15/evolution4.html.
#> It may be desirable to make the sf package available;
#> package maintainers should consider adding sf to Suggests:.
#> The sp package is now running under evolution status 2
#>      (status 2 uses the sf package in place of rgdal)
#> {peacesciencer} includes additional remote data for separate download. Please type ?download_extdata() for more information.
#> This message disappears on load when these data are downloaded and in the package's `extdata` directory.
library(isard)
library(kableExtra)
#>
#> Attaching package: 'kableExtra'
#>
#> The following object is masked from 'package:dplyr':
#>
#>     group_rows
library(stevemisc)
#>
#> Attaching package: 'stevemisc'
#>
#> The following object is masked from 'package:lubridate':
#>
#>     dst
#>
#> The following object is masked from 'package:dplyr':
#>
#>     tbl_df
library(stevethemes)
Missing data are everywhere in almost all statistical models in the political and social sciences. Canonical cases consider missingness in just the outcome variable, but it’s almost always the case that there are missing data across multiple (if not all) variables in a model. A regression model selects on complete cases and will thus punt rows from consideration in the model where any variable is missing. This is potentially a major problem for statistical inference, though the implication for inference is contingent on both type and scope.1 Generally, unless missing data are missing completely at random and/or missingness pervades less than 5% of the data, the potential for bias in the analysis looms large. Inter-state conflict researchers often do not consider how much this concerns their analysis because the number of observations in a given dyad-year or state-year analysis will still be in the high thousands. However, the remaining number of observations is less the point than the percentage missing and excluded from the analysis.
From my experience with dyad-year and state-year analyses, the
biggest offender here will be the democracy scores for states. The
reasons for this are multiple and mostly stem from the use of Polity
data. The Polity project, for all I can tell, may not necessarily be the
oldest cross-national data set on democracy for scholars who have been
doing peace science analyses for the past three or four decades.
However, the Polity data set is certainly one of the oldest
cross-national data sets on democracy and one of the oldest with great
coverage into the 19th century. This would coincide with the Correlates
of War state system data and the emergence of the militarized
inter-state dispute (MID) data in the 1980s and 1990s. The democracy
score that researchers would use was almost always the
polity2 variable in the data, which added the democracy
score and autocracy score together into a 21-item [-10:10] index.
Shortcomings here, though, are multiple, leaving aside comments about
whether we can adequately understand democracy as a battery of executive
constraints and execute-level open competition. For one, the Polity
project only considers states with a population of at least a million
whereas state system membership (certainly CoW) has a population
threshold of 500,000. This means a localized sample of post-World War II
conflicts won’t have any Eastern Caribbean observations in it and the
1983 invasion of Grenada won’t appear in the analyses. Further, the
Polity project is also replete with interregnum observations, which are
often treated as missing data because the missing codes operate outside
the 21-item index.
Consider the cw_democracy data I provide in
{isard} as illustrative of what’s at stake. You can (and
should for transparency’s sake) see the
underlying code that generates this data set on the Github
repository for that package. Briefly, this is a data set that takes
(ideally) the most recent versions of the Vdem data, the Polity data,
and Xavier Marquez’ extensions of the Unified Democracy Scores (UDS)
data and standardizes them to Correlates of War state system membership
data.
#library(tidyverse)
#library(peacesciencer)
#library(isard)

cw_democracy
#> # A tibble: 17,511 × 6
#>    ccode  year  euds    aeuds polity2 v2x_polyarchy
#>    <dbl> <dbl> <dbl>    <dbl>   <dbl>         <dbl>
#>  1     2  1816 0.803 -0.00435       6         0.359
#>  2     2  1817 0.803 -0.00435       6         0.357
#>  3     2  1818 0.803 -0.00435       6         0.359
#>  4     2  1819 0.803 -0.00435       6         0.359
#>  5     2  1820 0.803 -0.00435       6         0.354
#>  6     2  1821 0.803 -0.00435       6         0.349
#>  7     2  1822 0.803 -0.00435       6         0.349
#>  8     2  1823 0.803 -0.00435       6         0.348
#>  9     2  1824 0.803 -0.00435       6         0.348
#> 10     2  1825 0.811  0.00331       7         0.348
#> # ℹ 17,501 more rows
Doing this highlights just how much missingness there is in our democracy data. For example, let’s standardize these data to all observations between 1816 and 2010 and see how much of the data are missing.
cw_democracy %>%
  filter(between(year, 1816, 2010)) %>%
  summarize(perc_missing = sum(is.na(polity2))/length(polity2))
#> # A tibble: 1 × 1
#>   perc_missing
#>          <dbl>
#> 1        0.110
That’s not an ideal amount of missingness. Here would be the observations affected, starting with the states that don’t appear at all in the Polity data for this temporal domain.
# library(kableExtra)
cw_democracy %>%
  filter(between(year, 1816, 2010)) %>%
  group_by(ccode) %>%
  mutate(nobs = n()) %>%
  filter(is.na(polity2)) %>%
  group_by(ccode) %>%
  summarize(n = n(),
            nobs = unique(nobs),
            years = str_c(year, collapse = ", ")) -> missing_obs

missing_obs %>%
  filter(n == nobs) %>%
  mutate(country = countrycode::countrycode(ccode, "cown", "country.name")) %>%
  select(ccode, country, n, nobs) %>%
  kbl(., caption = "CoW States that Never Appear in the Polity Data") %>%
  kable_styling(position = "center", full_width = F, bootstrap_options = "striped")
#> Warning: 'xfun::attr()' is deprecated.
#> Use 'xfun::attr2()' instead.
#> See help("Deprecated")| ccode | country | n | nobs |
|---|---|---|---|
| 31 | Bahamas | 38 | 38 |
| 53 | Barbados | 45 | 45 |
| 54 | Dominica | 33 | 33 |
| 55 | Grenada | 37 | 37 |
| 56 | St. Lucia | 32 | 32 |
| 57 | St. Vincent & Grenadines | 32 | 32 |
| 58 | Antigua & Barbuda | 30 | 30 |
| 60 | St. Kitts & Nevis | 28 | 28 |
| 80 | Belize | 30 | 30 |
| 221 | Monaco | 18 | 18 |
| 223 | Liechtenstein | 21 | 21 |
| 232 | Andorra | 18 | 18 |
| 240 | Hanover | 30 | 30 |
| 273 | Hesse Electoral | 51 | 51 |
| 275 | Hesse Grand Ducal | 52 | 52 |
| 280 | Mecklenburg Schwerin | 25 | 25 |
| 300 | Austria-Hungary | 103 | 103 |
| 331 | San Marino | 19 | 19 |
| 338 | Malta | 47 | 47 |
| 347 | Kosovo | 3 | 3 |
| 395 | Iceland | 67 | 67 |
| 403 | São Tomé & Príncipe | 36 | 36 |
| 511 | Zanzibar | 2 | 2 |
| 591 | Seychelles | 35 | 35 |
| 781 | Maldives | 46 | 46 |
| 835 | Brunei | 27 | 27 |
| 935 | Vanuatu | 30 | 30 |
| 946 | Kiribati | 12 | 12 |
| 947 | Tuvalu | 11 | 11 |
| 955 | Tonga | 12 | 12 |
| 970 | Nauru | 12 | 12 |
| 983 | Marshall Islands | 20 | 20 |
| 986 | Palau | 17 | 17 |
| 987 | Micronesia (Federated States of) | 20 | 20 |
| 990 | Samoa | 35 | 35 |
These seem like uncontroversial omissions. Perhaps no one will miss Monaco or Tonga in a dyad-year model on conflict onset. However, there are several problematic omissions here. The exclusion of Hanover, the two Hesses (sic), and Mecklenburg means there will be some important conflict-dyad omissions for the various wars of German unification. Belize has (I would argue) a prominent, conspicuous, and interesting spatial rivalry with Guatemala. Guatemala has at points, has refused to acknowledge Belize’ right to exist, but Belize is no stranger to initiating low-level disputes on the border as well. The Eastern Caribbean omissions mean every observation in the 1983 invasion of Grenada will be dropped.
Here are the observations for which there is only situational missingness in the Polity data.
missing_obs %>%
  filter(n < nobs) %>%
  mutate(country = countrycode::countrycode(ccode, "cown", "country.name")) %>%
  select(ccode, country, everything()) %>%
  kbl(., caption = "Situational Missigness in the Polity Data")  %>%
  kable_styling(position = "center", full_width = F, bootstrap_options = "striped")
#> Warning: 'xfun::attr()' is deprecated.
#> Use 'xfun::attr2()' instead.
#> See help("Deprecated")| ccode | country | n | nobs | years |
|---|---|---|---|---|
| 41 | Haiti | 1 | 134 | 1915 |
| 42 | Dominican Republic | 4 | 110 | 1914, 1915, 1916, 1924 |
| 70 | Mexico | 3 | 180 | 1846, 1847, 1863 |
| 91 | Honduras | 4 | 112 | 1907, 1912, 1919, 1924 |
| 93 | Nicaragua | 2 | 111 | 1926, 1927 |
| 100 | Colombia | 1 | 180 | 1831 |
| 135 | Peru | 2 | 172 | 1881, 1882 |
| 140 | Brazil | 2 | 189 | 1822, 1823 |
| 210 | Netherlands | 1 | 191 | 1940 |
| 211 | Belgium | 2 | 177 | 1914, 1940 |
| 212 | Luxembourg | 2 | 88 | 1940, 1944 |
| 220 | France | 3 | 194 | 1940, 1941, 1942 |
| 225 | Switzerland | 32 | 195 | 1816, 1817, 1818, 1819, 1820, 1821, 1822, 1823, 1824, 1825, 1826, 1827, 1828, 1829, 1830, 1831, 1832, 1833, 1834, 1835, 1836, 1837, 1838, 1839, 1840, 1841, 1842, 1843, 1844, 1845, 1846, 1847 |
| 235 | Portugal | 4 | 195 | 1816, 1817, 1818, 1819 |
| 255 | Germany | 1 | 151 | 1945 |
| 265 | German Democratic Republic | 2 | 37 | 1989, 1990 |
| 267 | Baden | 3 | 56 | 1816, 1817, 1818 |
| 269 | Saxony | 1 | 52 | 1848 |
| 310 | Hungary | 2 | 93 | 1944, 1956 |
| 315 | Czechoslovakia | 2 | 70 | 1939, 1968 |
| 325 | Italy | 45 | 195 | 1816, 1817, 1818, 1819, 1820, 1821, 1822, 1823, 1824, 1825, 1826, 1827, 1828, 1829, 1830, 1831, 1832, 1833, 1834, 1835, 1836, 1837, 1838, 1839, 1840, 1841, 1842, 1843, 1844, 1845, 1846, 1847, 1848, 1849, 1850, 1851, 1852, 1853, 1854, 1855, 1856, 1857, 1858, 1859, 1860 |
| 329 | Two Sicilies | 1 | 46 | 1861 |
| 341 | Montenegro | 2 | 5 | 2006, 2007 |
| 345 | Yugoslavia | 62 | 131 | 1878, 1879, 1880, 1881, 1882, 1883, 1884, 1885, 1886, 1887, 1888, 1889, 1890, 1891, 1892, 1893, 1894, 1895, 1896, 1897, 1898, 1899, 1900, 1901, 1902, 1903, 1904, 1905, 1906, 1907, 1908, 1909, 1910, 1911, 1912, 1913, 1914, 1915, 1916, 1917, 1918, 1919, 1920, 1992, 1993, 1994, 1995, 1996, 1997, 1998, 1999, 2000, 2001, 2002, 2003, 2004, 2005, 2006, 2007, 2008, 2009, 2010 |
| 346 | Bosnia & Herzegovina | 16 | 19 | 1995, 1996, 1997, 1998, 1999, 2000, 2001, 2002, 2003, 2004, 2005, 2006, 2007, 2008, 2009, 2010 |
| 350 | Greece | 4 | 181 | 1916, 1917, 1918, 1919 |
| 355 | Bulgaria | 1 | 103 | 1913 |
| 360 | Romania | 1 | 133 | 1916 |
| 365 | Russia | 69 | 195 | 1923, 1924, 1925, 1926, 1927, 1928, 1929, 1930, 1931, 1932, 1933, 1934, 1935, 1936, 1937, 1938, 1939, 1940, 1941, 1942, 1943, 1944, 1945, 1946, 1947, 1948, 1949, 1950, 1951, 1952, 1953, 1954, 1955, 1956, 1957, 1958, 1959, 1960, 1961, 1962, 1963, 1964, 1965, 1966, 1967, 1968, 1969, 1970, 1971, 1972, 1973, 1974, 1975, 1976, 1977, 1978, 1979, 1980, 1981, 1982, 1983, 1984, 1985, 1986, 1987, 1988, 1989, 1990, 1991 |
| 366 | Estonia | 1 | 43 | 1918 |
| 367 | Latvia | 2 | 43 | 1918, 1919 |
| 385 | Norway | 1 | 102 | 1940 |
| 390 | Denmark | 1 | 191 | 1940 |
| 452 | Ghana | 3 | 54 | 1957, 1958, 1959 |
| 500 | Uganda | 1 | 49 | 1979 |
| 530 | Ethiopia | 19 | 109 | 1936, 1941, 1994, 1995, 1996, 1997, 1998, 1999, 2000, 2001, 2002, 2003, 2004, 2005, 2006, 2007, 2008, 2009, 2010 |
| 552 | Zimbabwe | 15 | 46 | 1965, 1966, 1967, 1968, 1969, 1970, 1971, 1972, 1973, 1974, 1975, 1976, 1977, 1978, 1979 |
| 616 | Tunisia | 57 | 112 | 1825, 1826, 1827, 1828, 1829, 1830, 1831, 1832, 1833, 1834, 1835, 1836, 1837, 1838, 1839, 1840, 1841, 1842, 1843, 1844, 1845, 1846, 1847, 1848, 1849, 1850, 1851, 1852, 1853, 1854, 1855, 1856, 1857, 1858, 1859, 1860, 1861, 1862, 1863, 1864, 1865, 1866, 1867, 1868, 1869, 1870, 1871, 1872, 1873, 1874, 1875, 1876, 1877, 1878, 1879, 1880, 1881 |
| 640 | Turkey | 4 | 195 | 1918, 1919, 1920, 1921 |
| 645 | Iraq | 7 | 79 | 2003, 2004, 2005, 2006, 2007, 2008, 2009 |
| 651 | Egypt | 33 | 102 | 1855, 1856, 1857, 1858, 1859, 1860, 1861, 1862, 1863, 1864, 1865, 1866, 1867, 1868, 1869, 1870, 1871, 1872, 1873, 1874, 1875, 1876, 1877, 1878, 1879, 1880, 1881, 1882, 1946, 1947, 1948, 1949, 1950 |
| 652 | Syria | 1 | 63 | 1958 |
| 660 | Lebanon | 15 | 65 | 1990, 1991, 1992, 1993, 1994, 1995, 1996, 1997, 1998, 1999, 2000, 2001, 2002, 2003, 2004 |
| 690 | Kuwait | 3 | 50 | 1961, 1962, 1990 |
| 700 | Afghanistan | 20 | 92 | 1979, 1980, 1981, 1982, 1983, 1984, 1985, 1986, 1987, 1988, 2001, 2002, 2003, 2004, 2005, 2006, 2007, 2008, 2009, 2010 |
| 710 | China | 11 | 151 | 1860, 1861, 1937, 1938, 1939, 1940, 1941, 1942, 1943, 1944, 1945 |
| 712 | Mongolia | 3 | 90 | 1921, 1922, 1923 |
| 740 | Japan | 1 | 145 | 1945 |
| 750 | India | 5 | 64 | 1947, 1948, 1949, 1950, 1951 |
| 770 | Pakistan | 25 | 64 | 1947, 1948, 1949, 1950, 1951, 1952, 1953, 1954, 1955, 1956, 1957, 1958, 1959, 1960, 1961, 1962, 1963, 1964, 1965, 1966, 1967, 1968, 1969, 1970, 1971 |
| 771 | Bangladesh | 1 | 40 | 1971 |
| 800 | Thailand | 1 | 124 | 1941 |
| 811 | Cambodia | 10 | 58 | 1979, 1980, 1981, 1982, 1983, 1984, 1985, 1986, 1987, 1988 |
| 816 | Vietnam | 34 | 57 | 1977, 1978, 1979, 1980, 1981, 1982, 1983, 1984, 1985, 1986, 1987, 1988, 1989, 1990, 1991, 1992, 1993, 1994, 1995, 1996, 1997, 1998, 1999, 2000, 2001, 2002, 2003, 2004, 2005, 2006, 2007, 2008, 2009, 2010 |
| 817 | Republic of Vietnam | 9 | 22 | 1954, 1965, 1966, 1967, 1968, 1969, 1970, 1971, 1972 |
| 940 | Solomon Islands | 1 | 33 | 2003 |
Some of these are really important omissions! Bosnia & Herzegovina only has democracy scores for its first three years in the system. Hungary has missing data incidentally coinciding with the year of the Soviet invasion in 1956. Tunisia’s entire first spell in the CoW state system is missing, as are the first few years of its reappearance in the 1950s. Over 40% of the short-lived Republic of Vietnam’s democracy data are missing. Missingness in Europe coinciding with the end of World War I is going to drop a lot of important conflicts of the time (see: Latvia in 1918 and 1919). The Dominican Republic’s democracy scores go missing, just in time to drop the U.S. invasion of it from any analysis. Incidentally, a lot of missing observations here are going to collide with major conflicts. Perhaps a researcher can sidestep some of these problems by lagging the democracy variable a year, but that won’t fix all of them. After all, some countries are effectively born in/from conflict (e.g. Bosnia, India, Pakistan, the two Koreas, and more). If a researcher is not careful here, there will be more missingness in the data than meets the eye.
There’s no reason to accept these missing observations as a cost of
doing business with Polity. That’s why peacesciencer (by
way of {isard}) brings in multiple data sets that have
better coverage than Polity. The most unique of these comes from Xavier Marquez’ extension of the Unified
Democracy Scores (UDS) data. The UDS data were designed to be a
sort of “compromise” between competing measures of democracy, but
the underlying statistical model—the graded response model—serves as a
missing data fix too. If, say, the Polity project does not have
observations of a particular state in a given year, the model leans on
other inputs to derive a democracy estimate. The standard error of the
estimate increases with missing inputs, but a lot of measures of
democracy correlate highly regardless. The ensuing estimate, drawn from
a standard normal distribution, serves as a solid estimate of the level
democracy in a given year. It’s included in cw_democracy as
euds (or aeuds if you want 0 in the estimate
to represent the average cut-point for the dichotomous indicators).2
Here are a few cases of Xavier Marquez’ filling in missing data while also passing the look test. First, here’s Turkey.3
cw_democracy %>%
  # select(-v2x_polyarchy) %>%
  filter(ccode == 640) %>%
  gather(var, val, -ccode, -year) %>%
  ggplot(.,aes(year, val)) +
  theme_steve() +
  facet_wrap(~var, nrow= 3, scales = "free") + geom_line() +
  labs(y = "", x = "",
       title = "Various Democracy Scores for Turkey, 1816-Present")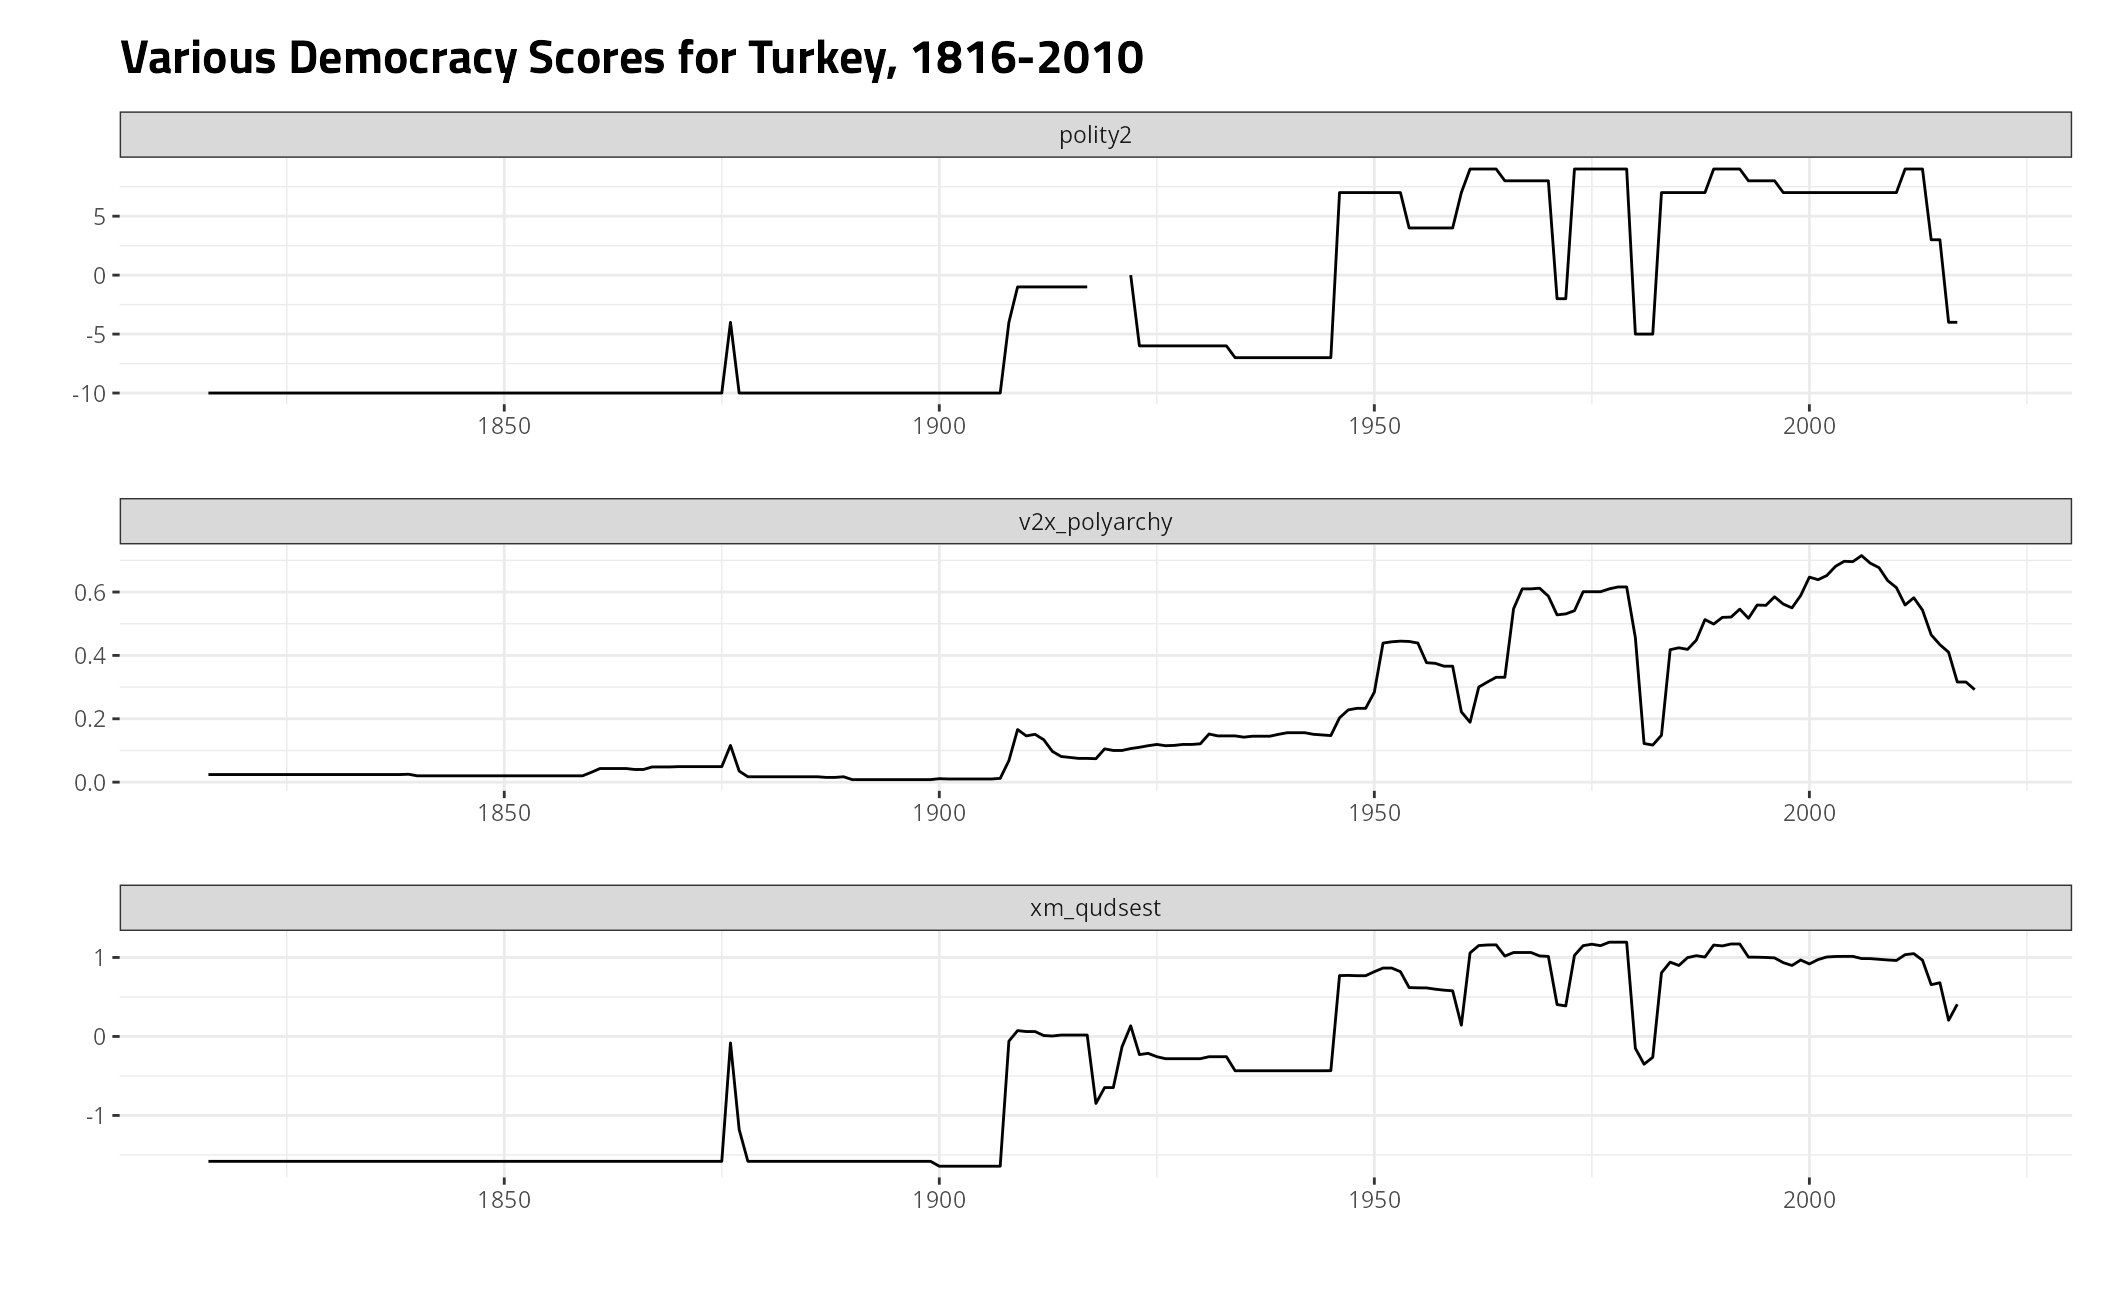
Here’s Afghanistan, a mostly non-democratic country throughout its history.
cw_democracy %>%
  # select(-v2x_polyarchy) %>%
  filter(ccode == 700) %>%
  gather(var, val, -ccode, -year) %>%
  ggplot(.,aes(year, val)) +
  theme_steve() +
  facet_wrap(~var, nrow= 3, scales = "free") + geom_line() +
  labs(y = "", x = "",
       title = "Various Democracy Scores for Afghanistan, 1919-Present")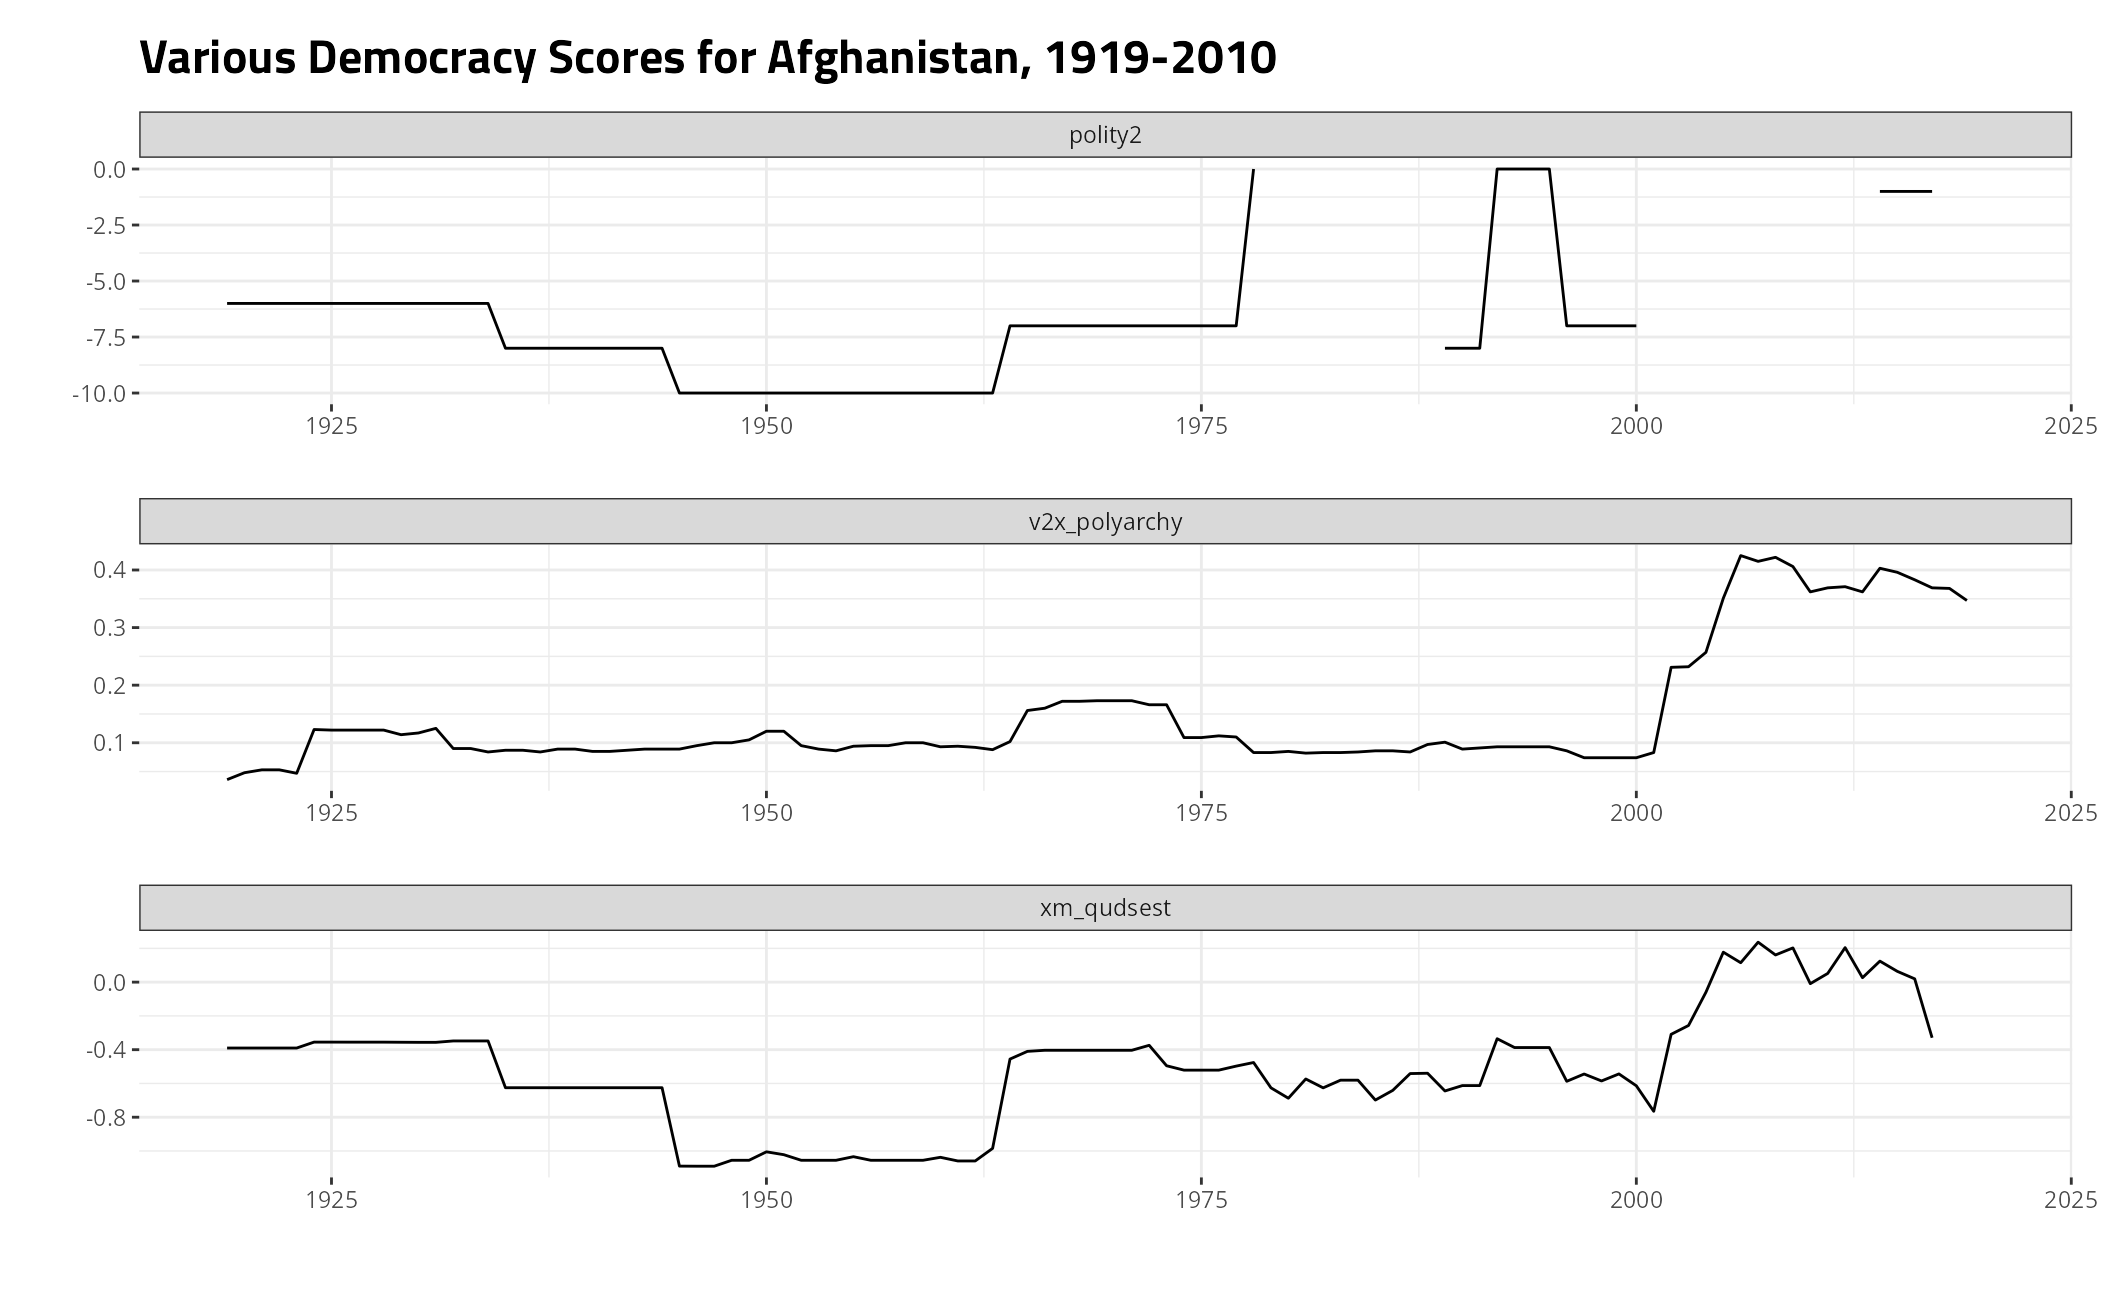
Here’s Portugal, a country that democratized at various points in its history.
cw_democracy %>%
  # select(-v2x_polyarchy) %>%
  filter(ccode == 235) %>%
  gather(var, val, -ccode, -year) %>%
  ggplot(.,aes(year, val)) +
  theme_steve() +
  facet_wrap(~var, nrow= 3, scales = "free") + geom_line() +
  labs(y = "", x = "",
       title = "Various Democracy Scores for Portugal, 1816-Present")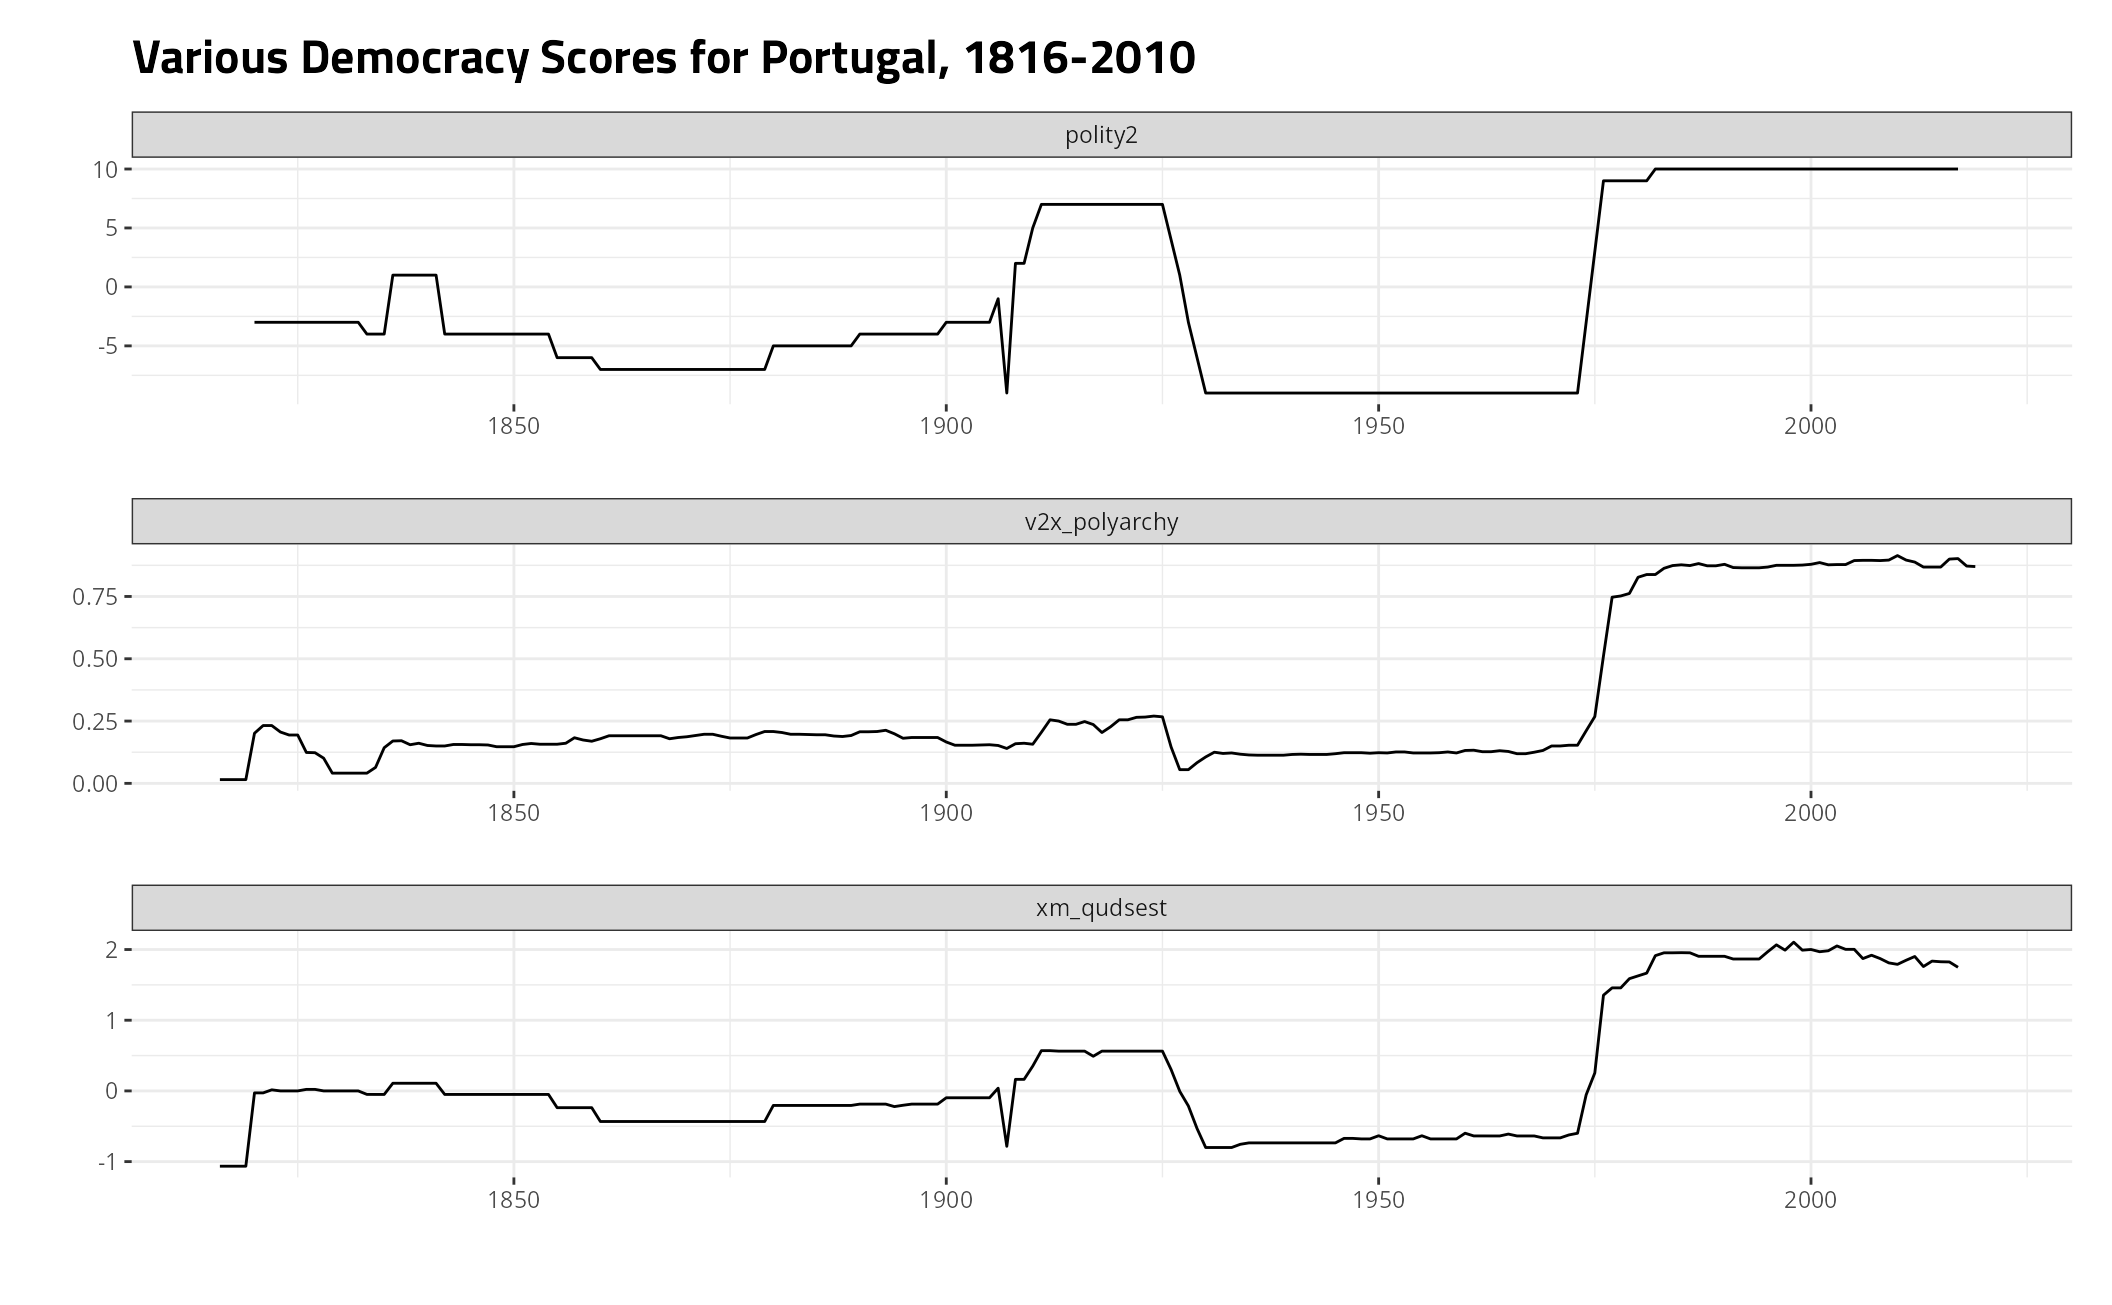
Here’s a correlation matrix for the three democracy estimates across
time and space. Notice that Marquez’ UDS extensions correlate with
polity2 at .94 and with the Vdem data at .91. That’s better
than the correlation between polity2 and the Vdem data.
cw_democracy %>%
  select(euds:ncol(.)) %>%
  cor(use="complete.obs")
#>                    euds     aeuds   polity2 v2x_polyarchy
#> euds          1.0000000 1.0000000 0.9316337     0.9372850
#> aeuds         1.0000000 1.0000000 0.9316337     0.9372850
#> polity2       0.9316337 0.9316337 1.0000000     0.8679665
#> v2x_polyarchy 0.9372850 0.9372850 0.8679665     1.0000000
More importantly, look at the data coverage of the UDS extensions vis-a-vis alternatives.
cw_democracy %>%
  filter(between(year, 1816, 2010)) %>%
  summary
#>      ccode            year           euds             aeuds
#>  Min.   :  2.0   Min.   :1816   Min.   :-1.7574   Min.   :-2.5651
#>  1st Qu.:200.0   1st Qu.:1917   1st Qu.:-0.2513   1st Qu.:-1.0591
#>  Median :359.0   Median :1967   Median : 0.2374   Median :-0.5704
#>  Mean   :393.6   Mean   :1949   Mean   : 0.4166   Mean   :-0.3911
#>  3rd Qu.:616.0   3rd Qu.:1991   3rd Qu.: 1.0710   3rd Qu.: 0.2633
#>  Max.   :990.0   Max.   :2010   Max.   : 3.0299   Max.   : 2.2222
#>                                 NA's   :53        NA's   :53
#>     polity2        v2x_polyarchy
#>  Min.   :-10.000   Min.   :0.0080
#>  1st Qu.: -7.000   1st Qu.:0.1340
#>  Median : -2.000   Median :0.2300
#>  Mean   : -0.334   Mean   :0.3360
#>  3rd Qu.:  7.000   3rd Qu.:0.5342
#>  Max.   : 10.000   Max.   :0.9230
#>  NA's   :1633      NA's   :701

cw_democracy %>%
  filter(between(year, 1816, 2010)) %>%
  filter(is.na(euds)) -> missing_euds

missing_euds
#> # A tibble: 53 × 6
#>    ccode  year  euds aeuds polity2 v2x_polyarchy
#>    <dbl> <dbl> <dbl> <dbl>   <dbl>         <dbl>
#>  1   300  1867    NA    NA      NA         0.188
#>  2   300  1868    NA    NA      NA         0.192
#>  3   300  1869    NA    NA      NA         0.192
#>  4   300  1870    NA    NA      NA         0.205
#>  5   300  1871    NA    NA      NA         0.201
#>  6   300  1872    NA    NA      NA         0.201
#>  7   300  1873    NA    NA      NA         0.214
#>  8   300  1874    NA    NA      NA         0.214
#>  9   300  1875    NA    NA      NA         0.211
#> 10   300  1876    NA    NA      NA         0.211
#> # ℹ 43 more rows
Marquez’ UDS extensions are missing for just four cases: Austria-Hungary in 1918, Two Sicilies in 1861, Tunisia in 1881, and Egypt in 1882. That’s better coverage than the alternatives. A user can accept these as missing observations since they involve just four cases. Alternatively, a user can knock off three of those with some kind of parlor trick like this.
M1 <- lm(euds ~ polity2, data=cw_democracy)
M2 <- lm(euds ~ v2x_polyarchy, data=cw_democracy)

pol_intercept <- broom::tidy(M1)[1, 2] %>% pull()
pol_coef <- broom::tidy(M1)[2, 2] %>% pull()

vdem_intercept <- broom::tidy(M2)[1, 2] %>% pull()
vdem_coef <- broom::tidy(M2)[2, 2] %>% pull()

cw_democracy %>%
  mutate(impute_pol = pol_intercept + polity2*pol_coef,
         impute_vdem = vdem_intercept + v2x_polyarchy*vdem_coef) %>%
  mutate(imputed = case_when(
    is.na(euds) & !is.na(polity2) ~ impute_pol,
    is.na(euds) & !is.na(v2x_polyarchy) ~ impute_vdem,
    TRUE ~ euds
  )) %>% select(-euds) %>%
  left_join(missing_euds, .)
#> Joining with `by = join_by(ccode, year, aeuds, polity2, v2x_polyarchy)`
#> # A tibble: 53 × 9
#>    ccode  year  euds aeuds polity2 v2x_polyarchy impute_pol impute_vdem  imputed
#>    <dbl> <dbl> <dbl> <dbl>   <dbl>         <dbl>      <dbl>       <dbl>    <dbl>
#>  1   300  1867    NA    NA      NA         0.188         NA   -0.0511   -5.11e-2
#>  2   300  1868    NA    NA      NA         0.192         NA   -0.0389   -3.89e-2
#>  3   300  1869    NA    NA      NA         0.192         NA   -0.0389   -3.89e-2
#>  4   300  1870    NA    NA      NA         0.205         NA    0.000648  6.48e-4
#>  5   300  1871    NA    NA      NA         0.201         NA   -0.0115   -1.15e-2
#>  6   300  1872    NA    NA      NA         0.201         NA   -0.0115   -1.15e-2
#>  7   300  1873    NA    NA      NA         0.214         NA    0.0280    2.80e-2
#>  8   300  1874    NA    NA      NA         0.214         NA    0.0280    2.80e-2
#>  9   300  1875    NA    NA      NA         0.211         NA    0.0189    1.89e-2
#> 10   300  1876    NA    NA      NA         0.211         NA    0.0189    1.89e-2
#> # ℹ 43 more rows
Whatever you choose to do here, a conflict researcher should take
missing data seriously in their democracy estimates.
peacesciencer does, which is why the
add_democracy() function in this package does more than
merge in Polity data.