Grab World Bank Data in R with {WDI}

- The World Bank
My graduate studies program director asked me to teach an independent study for a graduate student this semester. The goal is to better train the student for their research agenda beyond what I could plausibly teach them in a given semester.1 Toward that end, I’m going to offer most (if not all) of the independent study sessions as posts on my blog. This should help the student and possibly help others who stumble onto my website. Going forward, I’m probably just going to copy-paste this introduction for future posts for this independent study.
The particular student is pursuing a research program in international political economy. Substantively, much of what they want to do is outside my wheelhouse. However, I can offer some things to help the student with their research. The first lesson was a tutorial on various state (country) classification systems. The second was on the various joins in R. This tutorial will be about using the {WDI} package in R to grab all sorts of economic information from the World Bank.
Here’s a table of contents for what follows.
- The Issue: You’re Interested in Economic Data and Don’t Want to “Download” It
- How
{WDI}Works - How I Recommend Using
{WDI} - An Applied Example for my Student’s Interests
The Issue: You’re Interested in Economic Data and Don’t Want to “Download” It
My student is primarily interested in international political economy and it would be a boon to their research to be able to access economic data with some ease. This seems like it should be no issue at all, but there are a few potential pitfalls. These may not be a big issue, per se, but they’re also not obvious. For one, several economic data sets are often available just as flat files. The Penn World Table stands out as illustrative here. There are a few R packages for these data, but they are really just R packages of the flat files themselves. A student who downloads these packages will need to be mindful of the version they are using and take inventory of where they are storing it. This will compound some issues of reproducibility or transparency since students who share their research are not often able to share the entirety of their raw data. Perhaps you also don’t want to be like me either; since about 2008 (when I got on Dropbox), I’ve hoarded about 75.8 GB of raw data for my research.
One of the most convenient things to do here is to avoid “downloading” economic data of interest in favor of grabbing it from the internet through an application programming interface (API). Many agencies/data repositories have APIs through which more talented programmers than me can interface with it to seamlessly retrieve data. In my own travels, I have APIs set up through the U.S. Census, the National Oceanic and Atmospheric Administration, the Federal Reserve Bank of St. Louis, and the Bureau of Labor Statistics. Those are topics for another time. There is an API at the International Monetary Fund (IMF), though I’ll confess the available interfaces through the IMF have made zero sense to me. I think one of the easiest ones, and maybe the most useful for my student, is the World Bank’s API. Here, we again thank Vincent Arel-Bundock for his many contributions to social science research. I may not know what the World Bank’s API looks like underneath the hood, but {WDI} makes it seem super simple.
First, install {WDI} if you have not already.
install.packages("WDI")
Then, let’s load it along with some other stuff we’ll be using in this post.
library(tidyverse)  # for most things
library(stevemisc)  # for my own vanity
library(WDI)        # for World Bank goodness
library(kableExtra) # for tables, where appropriate
How {WDI} Works
A typical call in {WDI} will use the eponymous WDI() function and will look something like this. Related, if you run WDI() in R with nothing else specified, this will be what is actually executed.
WDI(
  country = "all",
  indicator = "NY.GDP.PCAP.KD",
  start = 1960,
  end = 2020,
  extra = FALSE,
  cache = NULL,
  latest = NULL,
  language = "en"
)
The primary things you’ll want to explicitly specify in WDI() are the first four parameters. country will be a vector of countries (in ISO-2 character codes) for which you want data. This defaults to “all”, which grabs every country in the data along with some regional/income/global aggregates. indicator is the character vector of data you want (more on this later). If you don’t specify what data you want, it will knee-jerk grab the GDP per capita for all observations in constant 2010 USD. start and end specify the years for which you want data. To the best of my knowledge, the World Bank does not have observations older than 1960 and that is the default starting point. It does have data for which observations are unavailable in earlier years (e.g. its collection of armed forces personnel data, if you want it, from the Military Balance is only available starting in 1989). In cases like that, I think it makes more sense to just specify that you want all the data the World Bank has available and start whittling from there.
Run the WDI() function and you’ll get output that looks like this.
WDI() %>% as_tibble()
#> # A tibble: 16,226 × 4
#>    iso2c country                     NY.GDP.PCAP.KD  year
#>    <chr> <chr>                                <dbl> <int>
#>  1 ZH    Africa Eastern and Southern          1443.  2020
#>  2 ZH    Africa Eastern and Southern          1525.  2019
#>  3 ZH    Africa Eastern and Southern          1534.  2018
#>  4 ZH    Africa Eastern and Southern          1536.  2017
#>  5 ZH    Africa Eastern and Southern          1539.  2016
#>  6 ZH    Africa Eastern and Southern          1549.  2015
#>  7 ZH    Africa Eastern and Southern          1546.  2014
#>  8 ZH    Africa Eastern and Southern          1528.  2013
#>  9 ZH    Africa Eastern and Southern          1505.  2012
#> 10 ZH    Africa Eastern and Southern          1517.  2011
#> # … with 16,216 more rows
This returns the country/spatial unit (with the two-character ISO code, recalling a previous post on this matter), a name for the unit (country), the indicator(s) you wanted, and the year. Of note, you can specify extra = TRUE to get more identifying information about the country/spatial unit beyond the two-character ISO code and name. I recommend against this since it’s just more output than you probably want. Further, the indicator you want is returned “as is.” In other words, the column name is the exact code of the World Bank indicator. You’ll probably want to rename this for convenience.
How I Recommend Using {WDI}
{WDI} is a super simple application, but, if you’re not careful, it can seem really daunting. I don’t think that’s any fault of the package; it just does a lot and has a lot to offer. Unless you know exactly what you want, it may seem difficult to get what you want (and get it quickly) from {WDI}.
Consider that{WDI} has a search function. What if you’re just curious what data the World Bank has that the package can access? Related, what if you don’t know for sure what data you want? You can use the WDIsearch() function to help you potentially find the data you want. However, I caution against using this for reasons that will be obvious soon. Let’s use the example of GDP.
WDIsearch("GDP") %>% as_tibble()
#> # A tibble: 539 × 2
#>    indicator            name
#>    <chr>                <chr>
#>  1 5.51.01.10.gdp       "Per capita GDP growth"
#>  2 6.0.GDP_current      "GDP (current $)"
#>  3 6.0.GDP_growth       "GDP growth (annual %)"
#>  4 6.0.GDP_usd          "GDP (constant 2005 $)"
#>  5 6.0.GDPpc_constant   "GDP per capita, PPP (constant 2011 international $) "
#>  6 BG.GSR.NFSV.GD.ZS    "Trade in services (% of GDP)"
#>  7 BG.KAC.FNEI.GD.PP.ZS "Gross private capital flows (% of GDP, PPP)"
#>  8 BG.KAC.FNEI.GD.ZS    "Gross private capital flows (% of GDP)"
#>  9 BG.KLT.DINV.GD.PP.ZS "Gross foreign direct investment (% of GDP, PPP)"
#> 10 BG.KLT.DINV.GD.ZS    "Gross foreign direct investment (% of GDP)"
#> # … with 529 more rows
Basically, GDP is a ubiquitous economic indicator and appears in a lot of stuff you don’t want. The default output in {WDI} is not a tibble, so your console will get spammed with stuff that you may or may not find helpful.
Admittedly, this is a broad search knowing how common GDP is in economic indicators. If you were interested in something much more narrow, like the “ease of doing business” scores, the output is much easier to manage.
WDIsearch("ease of") %>% as_tibble()
#> # A tibble: 12 × 2
#>    indicator                                   name
#>    <chr>                                       <chr>
#>  1 IC.BUS.DFRN.XQ                              Ease of doing business score (0 …
#>  2 IC.BUS.EASE.DFRN.DB1014                     Global: Ease of doing business s…
#>  3 IC.BUS.EASE.DFRN.DB15                       Ease of doing business score (DB…
#>  4 IC.BUS.EASE.DFRN.DB16                       Global: Ease of doing business s…
#>  5 IC.BUS.EASE.DFRN.XQ.DB1719                  Global: Ease of doing business s…
#>  6 IC.BUS.EASE.XQ                              Ease of doing business index (1=…
#>  7 LP.LPI.ITRN.RK                              Ease of arranging competitively …
#>  8 LP.LPI.ITRN.XQ                              Logistics performance index: Eas…
#>  9 PROT.MINOR.INV.EASE.SHARE.LGL.XD.010.DB0614 Protecting minority investors: E…
#> 10 PROT.MINOR.INV.EASE.SHARE.LGL.XD.010.DB1519 Protecting minority investors: E…
#> 11 PROT.MINOR.INV.EASE.SSI.XD.0010.DB0614.DFRN Protecting minority investors: E…
#> 12 PROT.MINOR.INV.EASE.SSI.XD.0010.DB1519.DFRN Protecting minority investors: E…
Knowing what you (should) know about the data of interest, that tells you the indicator for the ease of doing business score is IC.BUS.DFRN.XQ. Make a note of it.
The WDIsearch() function may be situationally useful, but I recommend going to the website (especially if you’re completely new to these data). Go to data.worldbank.org and search indicators you want. If you enter “GDP” into the search bar there, it will suggest indicators that are much closer to what you likely want. Click something you like—we’ll go GDP in current USD—and look to see if these are the data you want. Thereafter, look at the URL. It will read something like https://data.worldbank.org/indicator/[convoluted World Bank indicator ID here]. Make a note of that convoluted World Bank indicator you want for your own records.
An Applied Example for my Student’s Interests
My student has expressed an interest in the following data made available by the World Bank. These are multiple and include 1) access to electricity (as % of population), 2) the current account balance (as % of GDP), 3) the ease of doing business score, 4) the consumer price index, and 5) the interest rate spread. They had identified these data by poking around the World Bank’s website, including the indicator IDs below.
| Indicator ID | Description |
|---|---|
| EG.ELC.ACCS.ZS | Access to electricity (% of population) |
| BN.CAB.XOKA.GD.ZS | Current account balance (% of GDP) |
| IC.BUS.DFRN.XQ | Ease of doing business score |
| FP.CPI.TOTL.ZG | Consumer price index |
| FR.INR.LNDP | Interest rate spread |
You can grab all available data here for this indicators with the following WDI() call.
WDI(indicator = c("EG.ELC.ACCS.ZS", # access to electricity
                  "BN.CAB.XOKA.GD.ZS", # current account balance
                  "IC.BUS.DFRN.XQ", # ease of doing business
                  "FP.CPI.TOTL.ZG", # CPI
                  "FR.INR.LNDP"), # interest rate spread
    start = 1960, end = 2020) %>% as_tibble() -> Data

Data
#> # A tibble: 16,226 × 8
#>    iso2c country     year EG.ELC.ACCS.ZS BN.CAB.XOKA.GD.ZS IC.BUS.DFRN.XQ
#>    <chr> <chr>      <int>          <dbl>             <dbl>          <dbl>
#>  1 1A    Arab World  1960             NA                NA             NA
#>  2 1A    Arab World  1961             NA                NA             NA
#>  3 1A    Arab World  1962             NA                NA             NA
#>  4 1A    Arab World  1963             NA                NA             NA
#>  5 1A    Arab World  1964             NA                NA             NA
#>  6 1A    Arab World  1965             NA                NA             NA
#>  7 1A    Arab World  1966             NA                NA             NA
#>  8 1A    Arab World  1967             NA                NA             NA
#>  9 1A    Arab World  1968             NA                NA             NA
#> 10 1A    Arab World  1969             NA                NA             NA
#> # … with 16,216 more rows, and 2 more variables: FP.CPI.TOTL.ZG <dbl>,
#> #   FR.INR.LNDP <dbl>
You’ll definitely want to rename those indicators to something more intuitive. Renaming by column index is perilous, so be careful that you know what column you’re renaming.
Data %>%
  rename(elecperpop = 4,
         cab = 5,
         edb = 6,
         cpi = 7,
         ratespread = 8) -> Data

Data
#> # A tibble: 16,226 × 8
#>    iso2c country     year elecperpop   cab   edb   cpi ratespread
#>    <chr> <chr>      <int>      <dbl> <dbl> <dbl> <dbl>      <dbl>
#>  1 1A    Arab World  1960         NA    NA    NA    NA         NA
#>  2 1A    Arab World  1961         NA    NA    NA    NA         NA
#>  3 1A    Arab World  1962         NA    NA    NA    NA         NA
#>  4 1A    Arab World  1963         NA    NA    NA    NA         NA
#>  5 1A    Arab World  1964         NA    NA    NA    NA         NA
#>  6 1A    Arab World  1965         NA    NA    NA    NA         NA
#>  7 1A    Arab World  1966         NA    NA    NA    NA         NA
#>  8 1A    Arab World  1967         NA    NA    NA    NA         NA
#>  9 1A    Arab World  1968         NA    NA    NA    NA         NA
#> 10 1A    Arab World  1969         NA    NA    NA    NA         NA
#> # … with 16,216 more rows
Alternatively, upon publication of this post, the package author reached out via Twitter and recommended this approach prior to the WDI() call.
What a great post, thanks! (And timed perfectly for lunch break.) The only thing I'd note is that WDI automatically renames your columns if your vector of indicators is named. I find it's pretty handy and transparent to just define a "dictionary" before calling the function. pic.twitter.com/Xi3IQht4dC
— Vincent Arel-Bundock (@VincentAB) February 25, 2021
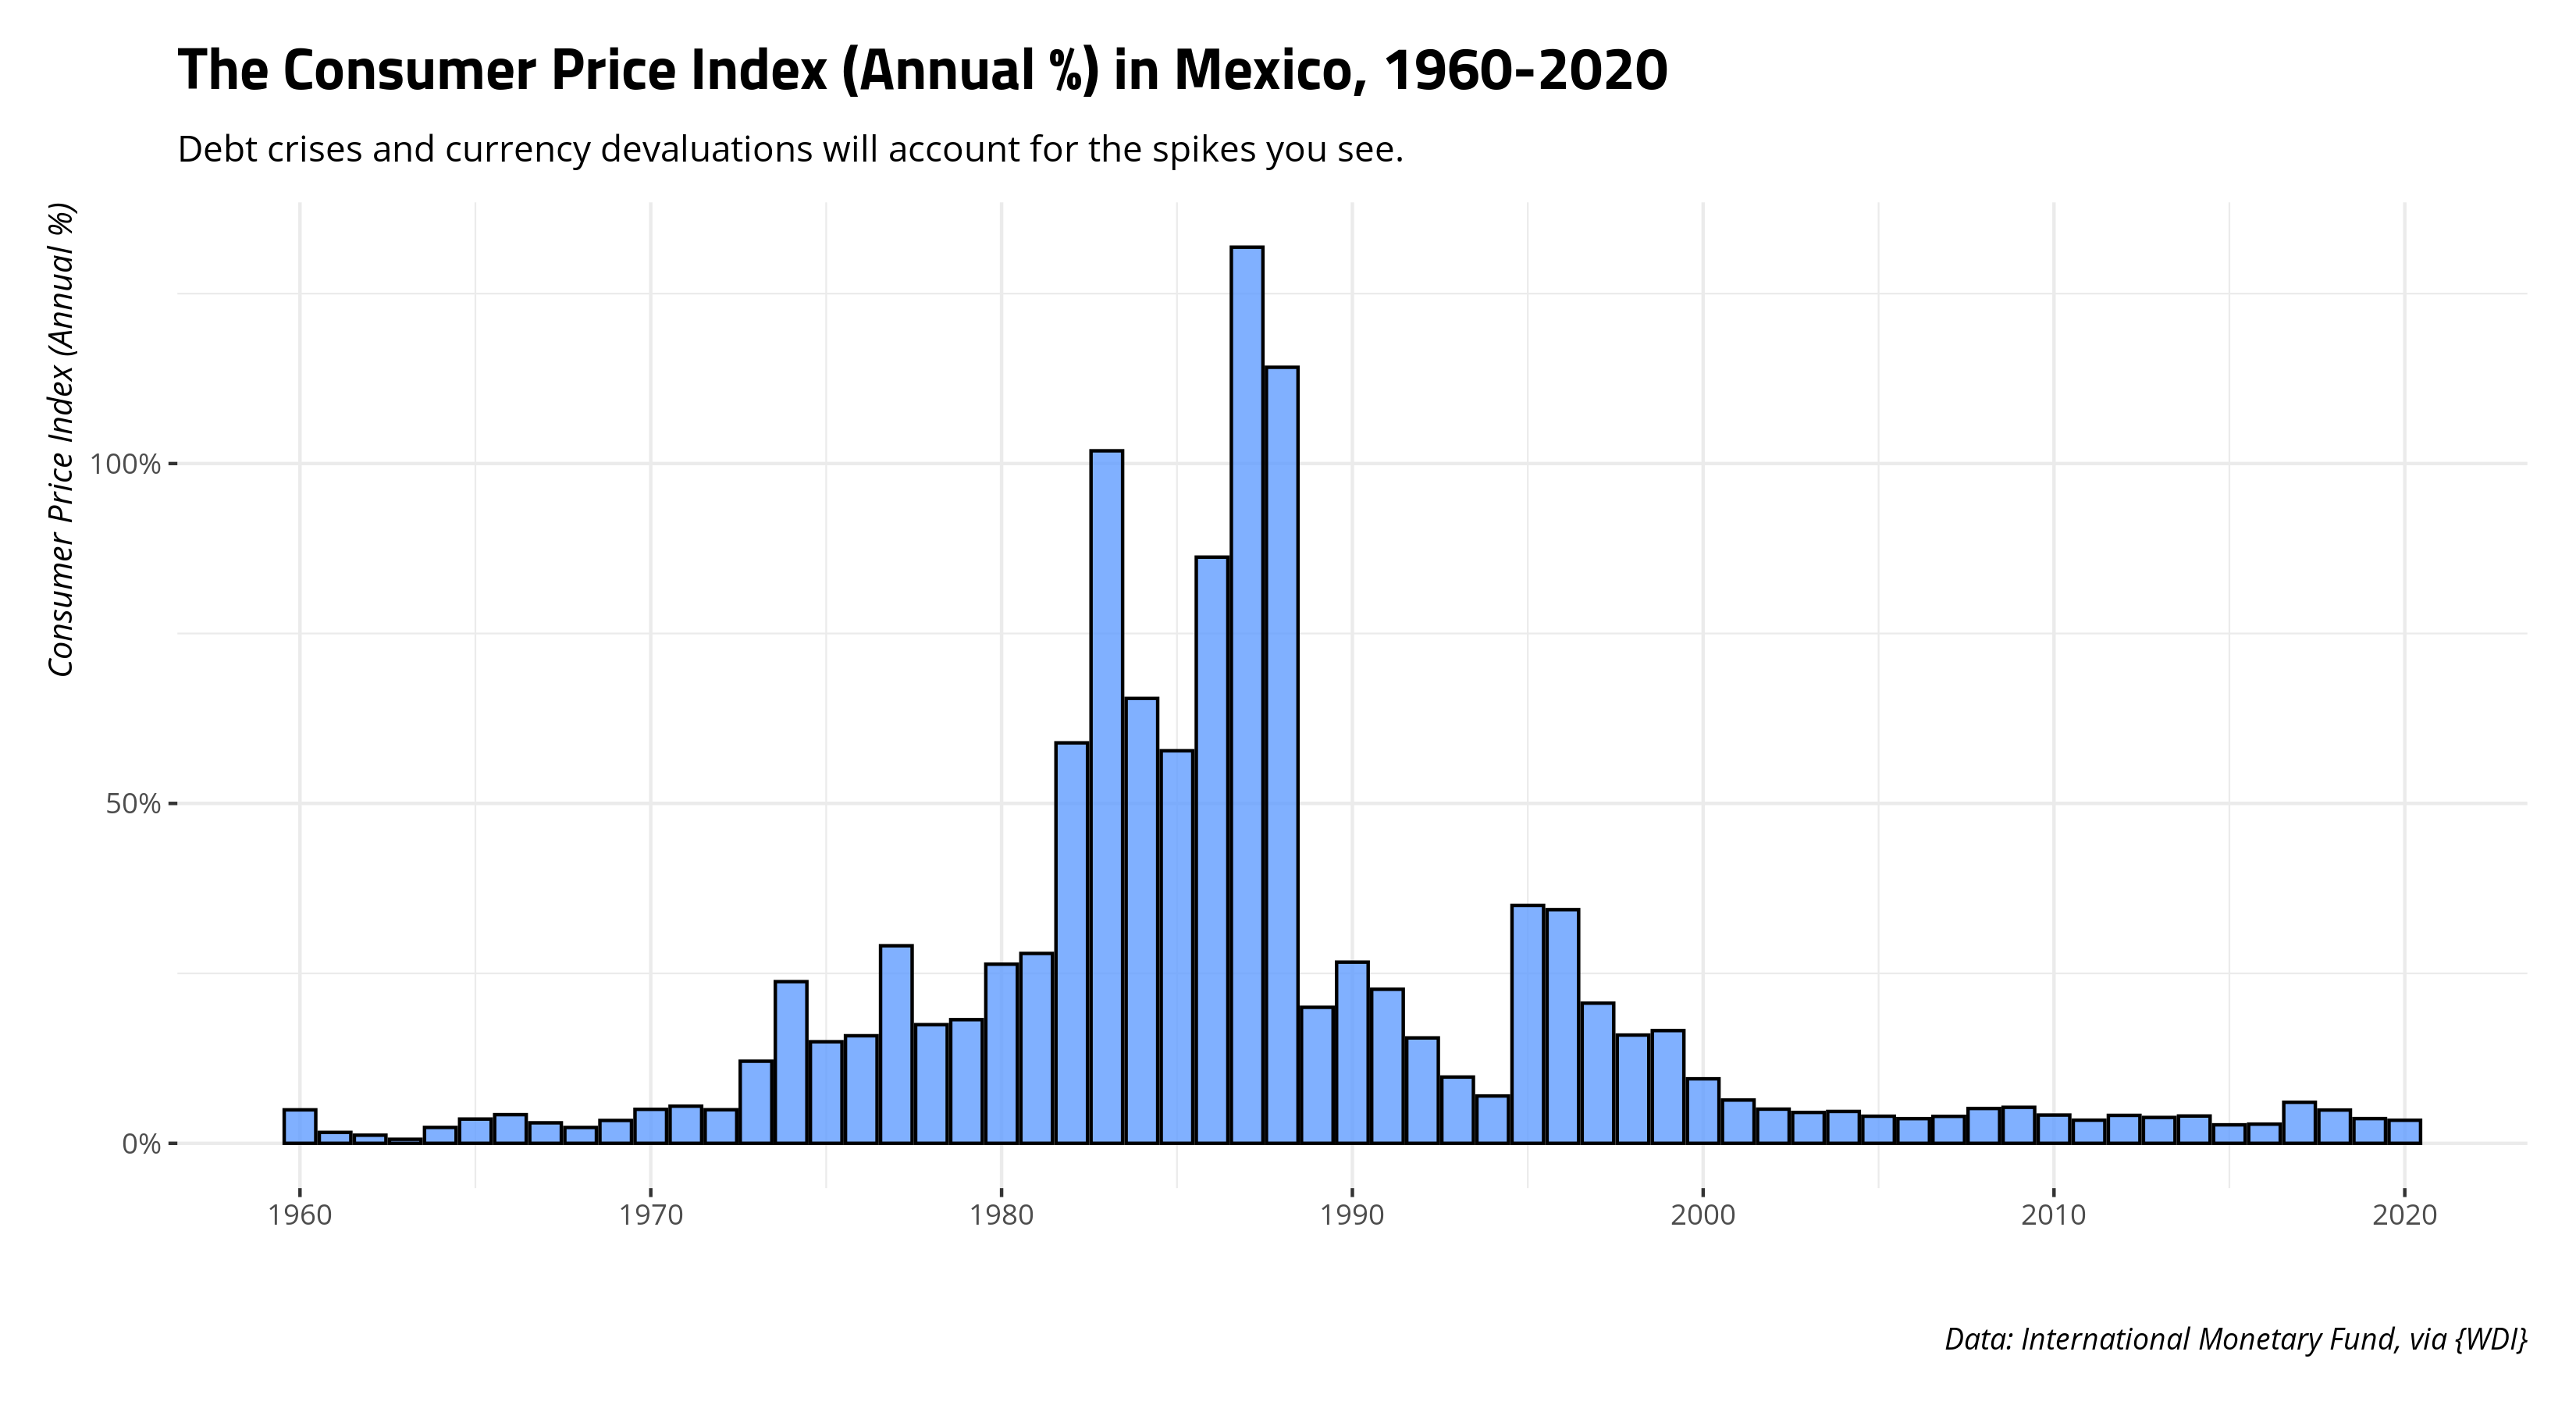
From here, you’re good to start playing around with the data acquired from the World Bank. You will, in all likelihood, want to consider getting rid of those regional/income aggregates in the data, but that will be a topic for another post. For example, here’s a chart on the inflation rate in Mexico over the available data. Of note: you should be able to see the 1980s debt crises and the Mexican peso crisis in these data.
Data %>%
  filter(country == "Mexico") %>%
  mutate(cpiprop = cpi/100) %>% # going somewhere with this...
  ggplot(.,aes(year, cpiprop)) +
  theme_steve_web() +
  geom_bar(stat="identity", alpha=.8, fill="#619cff", color="black") +
  scale_x_continuous(breaks = seq(1960, 2020, by = 10)) +
  # Below is why I like proportions
  scale_y_continuous(labels = scales::percent) +
  labs(x = "", y = "Consumer Price Index (Annual %)",
       caption = "Data: International Monetary Fund, via {WDI}",
       title = "The Consumer Price Index (Annual %) in Mexico, 1960-2020",
       subtitle = "Debt crises and currency devaluations will account for the spikes you see.")
There’s more fun to be had with some of these other data, I’m sure. I just happen to know the inflation data the best of these indicators that I grabbed in this simple application. No matter, the World Bank’s API seems really accessible for a lot of things, mostly thanks to the {WDI} package. Provided data.worldbank.org has the data you want, use {WDI} as your first choice for collecting it in R.
-
I’ll be using they/them pronouns here mostly for maximum anonymity. ↩
Disqus is great for comments/feedback but I had no idea it came with these gaudy ads.