The Dow Jones' No Good, Very Bad Day in Context

- That feeling when you realize you're not going to retire until your 70s. (Photo: Spencer Platt/Getty Images)
Last updated: March 28, 2020
Anyway, I’m of the mentality that reading too much into large nominal numbers in the Dow Jones Industrial Average is a fool’s errand. The U.S. is absolutely wealthier on the balance now than it was at almost every other point in the Dow Jones’ history. It means gains in nominal numbers will be larger. Losses in nominal numbers will be larger as well. Humility and scale are important in communicating information and trends from the Dow Jones.
That said, the Dow Jones’ day was clearly no good, and very bad. Here’s how you can contextualize that.
First, my stevemisc package has Dow Jones Industrial Average data dating all the way to 1885 in the data frame DJIA. I updated it not long ago to include the end of 2019. I haven’t added any 2020 observations to it yet, but that is easy to grab with the quantmod package. I also have presidential term data as part of the Presidents data set. Trump is not included in these data (because his term is still ongoing), but added him is simple in a tidyverse pipe.
library(stevemisc)
library(tidyverse)
library(lubridate)
library(quantmod)
library(knitr)
library(kableExtra)

getSymbols("^DJI", src="yahoo", from= as.Date("2020-01-01"))

DJI %>% data.frame %>%
  rownames_to_column() %>% tbl_df() %>%
  rename(date = rowname,
         djia = DJI.Close) %>%
  mutate(date = as_date(date)) %>%
  select(date, djia) %>%
  bind_rows(DJIA, .) -> DJI

Presidents %>%
  # add Trump
  bind_rows(.,tibble(president="Donald J. Trump",
                     start = ymd("2017-01-20"),
                     end = ymd(today()))) %>%
  # Grover Cleveland had two non-consecutive terms.
  mutate(president = ifelse(president == "Grover Cleveland" & start == "1885-03-04", "Grover Cleveland 1", president),
         president = ifelse(president == "Grover Cleveland" & start == "1893-03-04", "Grover Cleveland 2", president)) %>%
  # rowwise, list-seq, and unnest...
  rowwise() %>%
  mutate(date = list(seq(start, end, by = '1 day'))) %>%
  unnest(date) %>%
  # get just the president and date to left_join into the Dow data.
  select(president, date) %>%
  # Note: this will create some duplicates because of how terms start/end
  # It won't be much a problem for what we're doing here.
  left_join(DJI, .) %>%
  mutate(president = fct_inorder(president)) -> Data
One way of faithfully communicating Dow data—or any economic data, for that matter—is to index the data to some point. It’s why a lot of manufacturing data, for example, are indexed to 2010 or 2012 on FRED. Since the interest here is political (i.e. politicians like to take credit for good days on the Dow and deflect blame for bad days on the Dow), we can index the Dow trends within presidential administrations to the starting day of the presidency. Most indices start at 100, but we can have this start at 0 to more readily communicate growth and contraction in the Dow Jones Industrial Average within presidencies.
Data %>%
  # Note: Arthur isn't going to have a lot to look at here.
  group_by(president) %>%
  mutate(index = (djia/first(djia))-1) %>%
  ungroup() %>%
  mutate(cat = ifelse(index < 0, "Negative", "Positive")) %>%
  ggplot(.,aes(date, index,color=(index < 0))) +
  theme_steve_web() + post_bg() +
  geom_line(aes(group=1)) +
  geom_hline(yintercept = 0, linetype="dashed", alpha=0.4) +
  # I think '%y is the best I can do because of FDR's tenure.
  scale_x_date(date_labels = "'%y",
               date_breaks = "1 year") +
  facet_wrap(~president, scales = "free_x") +
  scale_color_manual(values=c("#009900", "#990000")) +
  theme(legend.position = "none") +
  labs(title = "The Dow Jones Industrial Average, Indexed to the Starting Point of Every Administration",
       subtitle = "The trends of the 'roaring '20s', the Great Depression, 1950s and 1990s growth, and post-collapse recoveries for FDR and Obama are apparent.",
       x = "Date",
       y = "Dow Jones Industrial Average, Indexed at Zero to the First Day of Trading for the Administration",
       caption = "Data: Dow Jones Industrial Average (Yahoo Finance, Pinnacle Systems, Measuring Worth), in the DJIA data (github.com/svmiller/stevemisc)")
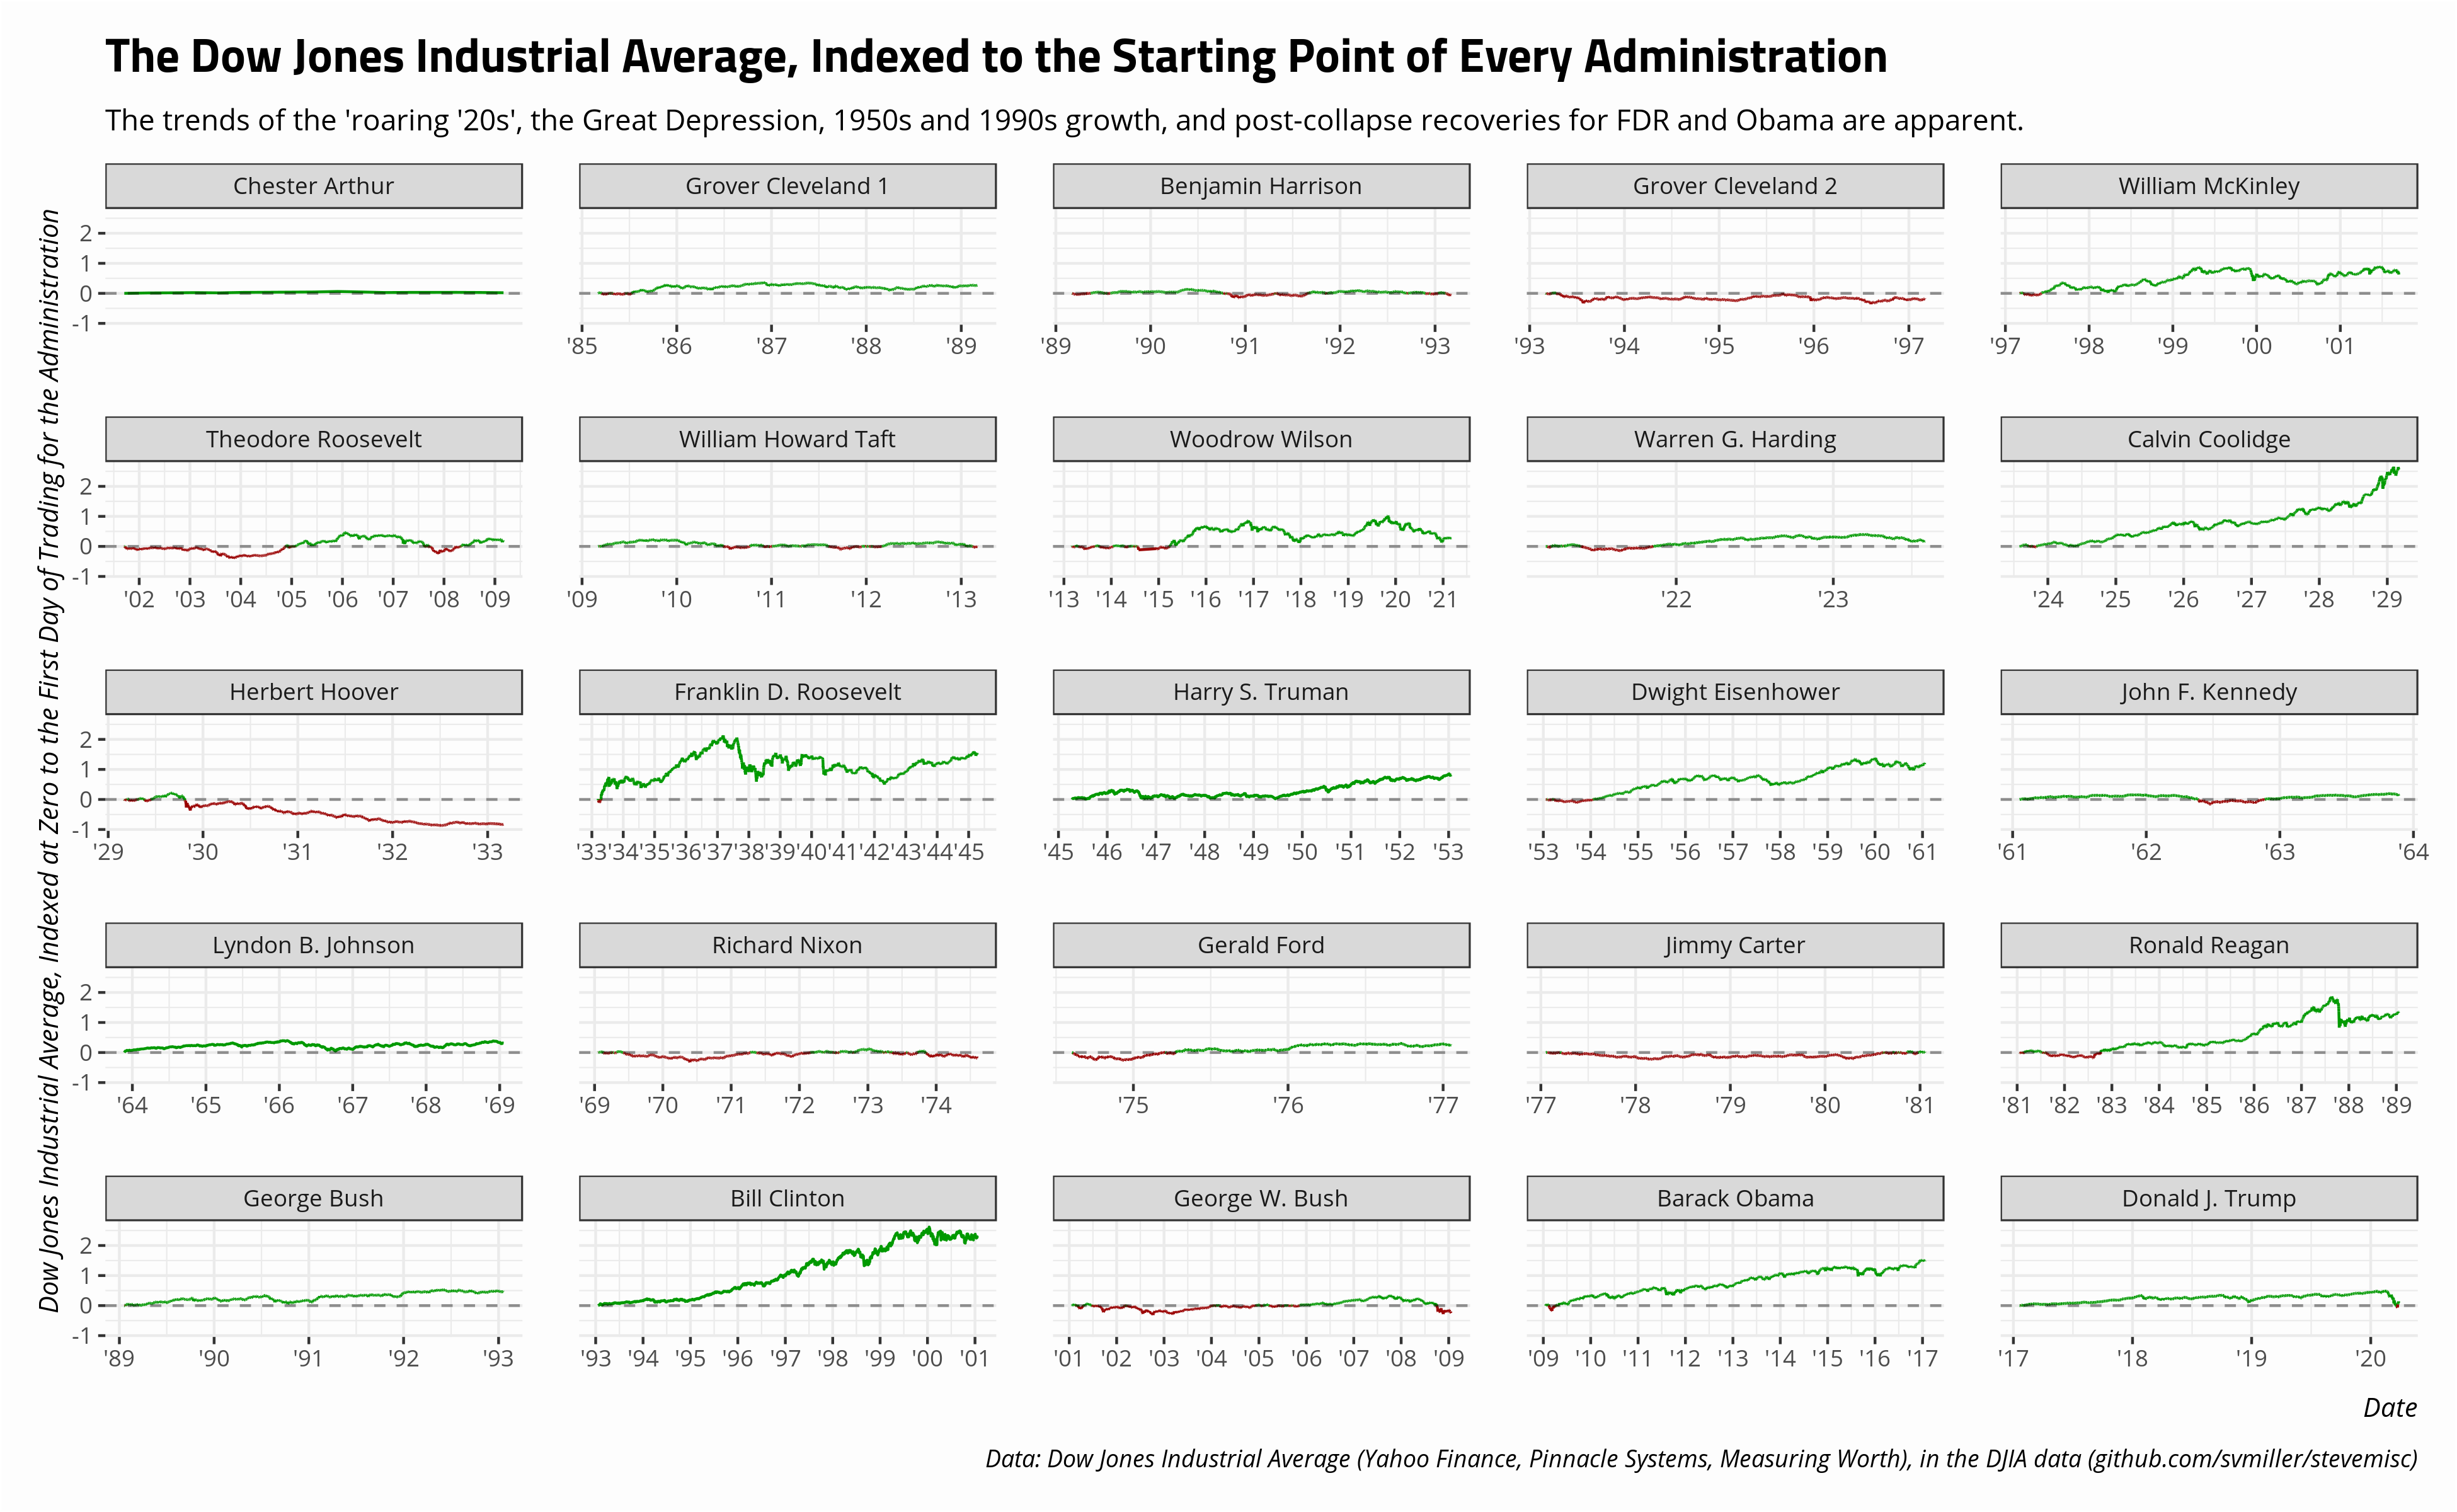
The data do well to show the scale of growth and contraction that defined these various presidencies. For example, we know the 1980s and 1990s were a period of high growth for the United States. This was made possible through a variety of factors, whether deregulation, technological change and innovation, and the Boomers entering their peak earning years. However, Ronald Reagan’s last day close was 2,235 (up from 951) and Bill Clinton’s last day close was 10,588 (up from 3,242). I’m old enough to remember the Dow crossing 10,000 for the first time being a big deal. However, those nominal numbers look paltry in modern times.
The other way of faithfully communicating good and bad trends in the Dow Jones Industrial Average is through a percentage change from some other benchmark’s close. In most applications, this would be the previous day’s close. Thus, what stands out from the blood-letting on the market on March 12, 2020 is less that it was the largest absolute drop from the previous day’s close in the Dow’s history. Again, it’s a fool’s errand to compare nominal numbers on the Dow. More importantly, it was the fourth-largest drop from the previous day’s close in the Dow’s history. That’s a bigger deal.
Calculating percentage changes in a time series is simple. Here, would be the 10 worst days in the Dow Jones’ history and the presidencies with which they concided.
Data %>%
  # We have some duplicates because of start/end dates for presidencies.
  # This should fix that
  group_by(president) %>%
  mutate(l1_djia = lag(djia,1),
         percchange = ((djia - lag(djia,1))/lag(djia, 1))*100) %>%
  arrange(percchange) %>%
  select(date, president, everything()) %>%
  head(10) %>%
  ungroup() %>%
  mutate_if(is.numeric, ~round(., 2)) %>%
   kable(., format="html", table.attr='id="stevetable"',
        col.names=c("Date", "President", "DJIA (Close)", "DJIA (Close, Previous)", "% Change"),
        caption = "The Ten Worst Trading Days in Dow Jones History, Feb. 16, 1885 to the Present",
        align=c("l","l","c","c","c","c"))
| Date | President | DJIA (Close) | DJIA (Close, Previous) | % Change |
|---|---|---|---|---|
| 1987-10-19 | Ronald Reagan | 1738.74 | 2246.73 | -22.61 |
| 2020-03-16 | Donald J. Trump | 20188.52 | 23185.62 | -12.93 |
| 1929-10-28 | Herbert Hoover | 260.64 | 298.97 | -12.82 |
| 1929-10-29 | Herbert Hoover | 230.07 | 260.64 | -11.73 |
| 2020-03-12 | Donald J. Trump | 21200.62 | 23553.22 | -9.99 |
| 1929-11-06 | Herbert Hoover | 232.13 | 257.68 | -9.92 |
| 1899-12-18 | William McKinley | 42.69 | 46.77 | -8.72 |
| 1895-12-20 | Grover Cleveland 2 | 29.42 | 32.16 | -8.51 |
| 1932-08-12 | Herbert Hoover | 63.11 | 68.90 | -8.40 |
| 1907-03-14 | Theodore Roosevelt | 55.84 | 60.89 | -8.29 |
There are not a whole lot of surprises. Ronald Reagan’s no-good-very-bad “Black Monday” crash was an all-timer and may not ever be topped. I forget the exact trading curbs initiated for the Dow Jones, but it’s likely trading would stop before that threshold is met in the future. Trump’s no-good-very-bad Thursday ranks fourth all-time and is surrounded by three Herbert Hoover observations at the core of the Great Depression.
For additional context, here’s every president’s worst trading day in Dow Jones history. Here, the data are ranked worst to best and the first appearance for all presidents is provided in this table.
Data %>%
  # We have some duplicates because of start/end dates for presidencies.
  # This should fix that
  group_by(president) %>%
  mutate(l1_djia = lag(djia,1),
         percchange = ((djia - lag(djia,1))/lag(djia, 1))*100) %>%
  arrange(percchange) %>%
  ungroup() %>%
  mutate(rank = seq(1:n())) %>%
  group_by(president) %>%
  filter(row_number() == 1) %>%
  mutate_if(is.numeric, ~round(., 2)) %>%
  select(date, president, everything()) %>%
    kable(., format="html", table.attr='id="stevetable"',
        col.names=c("Date", "President", "DJIA (Close)", "DJIA (Close, Previous)", "% Change", "Rank Among All-Time Worst Days"),
        caption = "The Worst Trading Days in Dow Jones History for Each President, Feb. 16, 1885 to the Present",
        align=c("l","l","c","c","c","c"))
| Date | President | DJIA (Close) | DJIA (Close, Previous) | % Change | Rank Among All-Time Worst Days |
|---|---|---|---|---|---|
| 1987-10-19 | Ronald Reagan | 1738.74 | 2246.73 | -22.61 | 1 |
| 2020-03-16 | Donald J. Trump | 20188.52 | 23185.62 | -12.93 | 2 |
| 1929-10-28 | Herbert Hoover | 260.64 | 298.97 | -12.82 | 3 |
| 1899-12-18 | William McKinley | 42.69 | 46.77 | -8.72 | 7 |
| 1895-12-20 | Grover Cleveland 2 | 29.42 | 32.16 | -8.51 | 8 |
| 1907-03-14 | Theodore Roosevelt | 55.84 | 60.89 | -8.29 | 10 |
| 2008-10-15 | George W. Bush | 8577.91 | 9310.99 | -7.87 | 12 |
| 1933-07-21 | Franklin D. Roosevelt | 88.71 | 96.26 | -7.84 | 13 |
| 1917-02-01 | Woodrow Wilson | 88.52 | 95.43 | -7.24 | 19 |
| 1997-10-27 | Bill Clinton | 7161.20 | 7715.40 | -7.18 | 20 |
| 1989-10-13 | George Bush | 2569.26 | 2759.84 | -6.91 | 27 |
| 1955-09-26 | Dwight Eisenhower | 455.56 | 487.45 | -6.54 | 34 |
| 1962-05-28 | John F. Kennedy | 576.93 | 611.88 | -5.71 | 48 |
| 1946-09-03 | Harry S. Truman | 178.68 | 189.19 | -5.56 | 53 |
| 2011-08-08 | Barack Obama | 10809.85 | 11444.61 | -5.55 | 54 |
| 1928-12-08 | Calvin Coolidge | 257.33 | 271.05 | -5.06 | 77 |
| 1913-01-20 | William Howard Taft | 59.74 | 62.82 | -4.90 | 89 |
| 1890-11-10 | Benjamin Harrison | 35.89 | 37.44 | -4.15 | 154 |
| 1886-05-17 | Grover Cleveland 1 | 35.11 | 36.59 | -4.05 | 172 |
| 1921-06-20 | Warren G. Harding | 64.90 | 67.57 | -3.95 | 186 |
| 1974-11-18 | Gerald Ford | 624.92 | 647.61 | -3.50 | 265 |
| 1973-11-26 | Richard Nixon | 824.95 | 854.00 | -3.40 | 283 |
| 1979-10-09 | Jimmy Carter | 857.59 | 884.04 | -2.99 | 389 |
| 1966-10-03 | Lyndon B. Johnson | 757.96 | 774.22 | -2.10 | 971 |
| 1885-02-27 | Chester Arthur | 31.77 | 32.33 | -1.75 | 1438 |
One mild surprise here is Lyndon Johnson. Among all presidents through the history of the Dow Jones Industrial Average, Johnson had—for lack of better term—the “second-best worst” trading day in history. The worst trading day of his presidency came on October 3, 1966, a contraction of just over 2% from the previous day’s close. His presidency was turbulent in more than a few ways and it’s any wonder he didn’t have a worse day.
Update for March 27, 2020
You could also extend this approach to look at the worst 30-day trading windows to further contextualize what’s happening now. All it takes is change the lagged variable (l1_djia) from 1 to 30 (i.e. l30_djia = lag(djia, 30). This would create a 30-day rolling window, within presidential administrations, to calculate the worst 30-day slides from time point t to time point t+30. Here, for example, are the 10 worst rolling windows over a 30-day period.
| Date | President | DJIA (Close) | DJIA (Close, Previous) | % Change |
|---|---|---|---|---|
| 1929-11-13 | Herbert Hoover | 198.69 | 329.95 | -39.78 |
| 1929-11-12 | Herbert Hoover | 209.74 | 344.50 | -39.12 |
| 1931-10-05 | Herbert Hoover | 86.48 | 140.78 | -38.57 |
| 2020-03-23 | Donald J. Trump | 18591.93 | 29102.51 | -36.12 |
| 1929-10-29 | Herbert Hoover | 230.07 | 359.00 | -35.91 |
| 1929-11-11 | Herbert Hoover | 220.39 | 342.57 | -35.67 |
| 2020-03-20 | Donald J. Trump | 19173.98 | 29379.77 | -34.74 |
| 1929-11-18 | Herbert Hoover | 227.56 | 345.72 | -34.18 |
| 1931-12-17 | Herbert Hoover | 73.79 | 112.01 | -34.12 |
| 1931-12-14 | Herbert Hoover | 77.22 | 115.60 | -33.20 |
You can also drive the point home about how precarious our current situation is by flipping one line of script in the above R code that calculates the worst individual trading days in Dow Jones history. See the above code that reads? arrange(percchange)? Replace it with arrange(-percchange) to get the best individual days in Dow history. Here, we’ll select the top 20.
| Date | President | DJIA (Close) | DJIA (Close, Previous) | % Change |
|---|---|---|---|---|
| 1931-10-06 | Herbert Hoover | 99.34 | 86.48 | 14.87 |
| 1929-10-30 | Herbert Hoover | 258.47 | 230.07 | 12.34 |
| 2020-03-24 | Donald J. Trump | 20704.91 | 18591.93 | 11.37 |
| 1932-09-21 | Herbert Hoover | 75.16 | 67.49 | 11.36 |
| 2008-10-13 | George W. Bush | 9387.61 | 8451.19 | 11.08 |
| 2008-10-28 | George W. Bush | 9065.12 | 8175.77 | 10.88 |
| 1987-10-21 | Ronald Reagan | 2027.85 | 1841.01 | 10.15 |
| 1932-08-03 | Herbert Hoover | 58.22 | 53.16 | 9.52 |
| 1932-02-11 | Herbert Hoover | 78.60 | 71.80 | 9.47 |
| 2020-03-13 | Donald J. Trump | 23185.62 | 21200.62 | 9.36 |
| 1929-11-14 | Herbert Hoover | 217.28 | 198.69 | 9.36 |
| 1931-12-18 | Herbert Hoover | 80.69 | 73.79 | 9.35 |
| 1932-02-13 | Herbert Hoover | 85.82 | 78.60 | 9.19 |
| 1932-05-06 | Herbert Hoover | 59.01 | 54.10 | 9.08 |
| 1933-04-19 | Franklin D. Roosevelt | 68.31 | 62.65 | 9.03 |
| 1931-10-08 | Herbert Hoover | 105.79 | 97.32 | 8.70 |
| 1932-06-10 | Herbert Hoover | 48.94 | 45.32 | 7.99 |
| 1939-09-05 | Franklin D. Roosevelt | 148.12 | 138.09 | 7.26 |
| 1931-06-03 | Herbert Hoover | 130.37 | 121.70 | 7.12 |
| 1932-01-06 | Herbert Hoover | 76.31 | 71.24 | 7.12 |
It’s worth saying growth in trading is ideally supposed to be incremental over the long-run. Huge volatility in trading runs both ways, never seeming to coincide with something good on the balance.
Update for March 28, 2020
You can also use these data to assess just how confident we should be in magnitude gains from Monday to Friday. For example, multiple outlets are claiming that this week is the best week for trading since 1938, notwithstanding the loss on Friday. Consider this summary from Barrons:
After the index’s eighth losing Friday in nine weeks, the Dow ended the week up 2,462.80 points, or 12.84%, to 21,636.78—its best week since 1938. The S&P 500 index gained 10.26%, to 2,541.47, and the Nasdaq Composite rose 9.05%, to 7502.38.
Here’s how you can assess that claim with some context (check the file in the _source directory for full code).
| President | Week Starting | DJIA (Start of the Week) | DJIA (Close, Last Day of the Week) | % Change |
|---|---|---|---|---|
| Herbert Hoover | 1932-08-01 | 54.26 | 62.60 | 15.37 |
| Franklin D. Roosevelt | 1938-06-20 | 113.23 | 129.06 | 13.98 |
| Donald J. Trump | 2020-03-23 | 19173.98 | 21636.78 | 12.84 |
| Franklin D. Roosevelt | 1933-03-13 | 53.84 | 60.73 | 12.80 |
| Herbert Hoover | 1932-07-25 | 47.84 | 53.89 | 12.65 |
| Herbert Hoover | 1931-10-05 | 92.77 | 104.46 | 12.60 |
| Gerald Ford | 1974-10-07 | 584.56 | 658.17 | 12.59 |
| Franklin D. Roosevelt | 1933-10-23 | 83.64 | 93.22 | 11.45 |
| Theodore Roosevelt | 1903-08-10 | 34.71 | 38.68 | 11.44 |
| George W. Bush | 2008-10-27 | 8378.95 | 9325.01 | 11.29 |
A recurring trend in these posts is that I’m skeptical that many of the boastful claims about the performance of the Dow Jones industrial average of late amount to wishful thinking absent any type of context of the other times the Dow Jones had great days or great weeks. It’s akin to Homer Simpson chasing his roast pig. “It’s still good! It’s still good!” Buddy, it might be gone.
Disqus is great for comments/feedback but I had no idea it came with these gaudy ads.