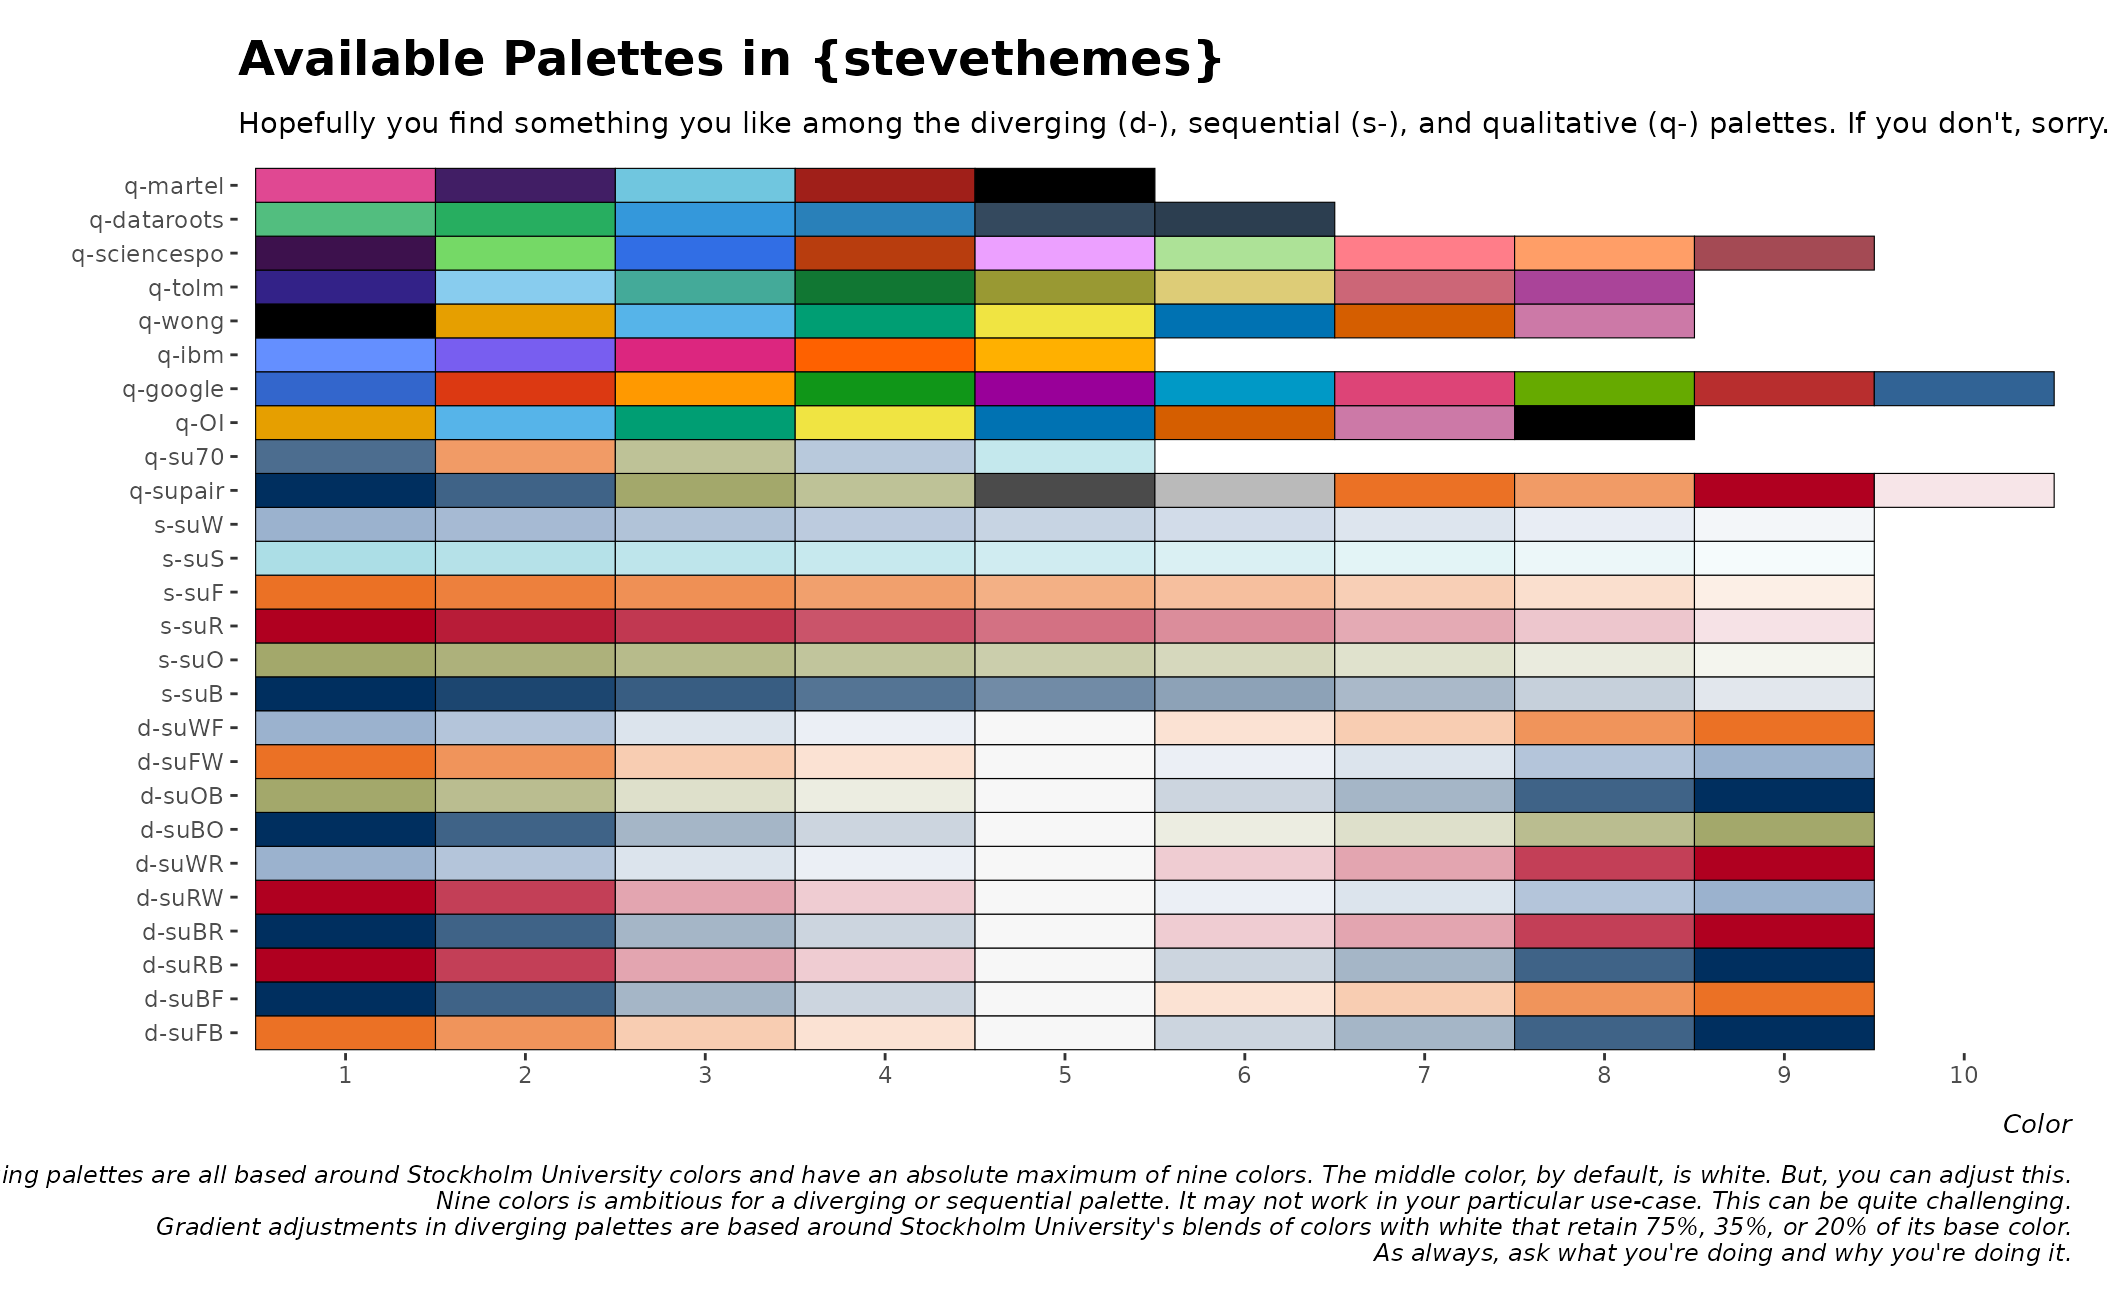
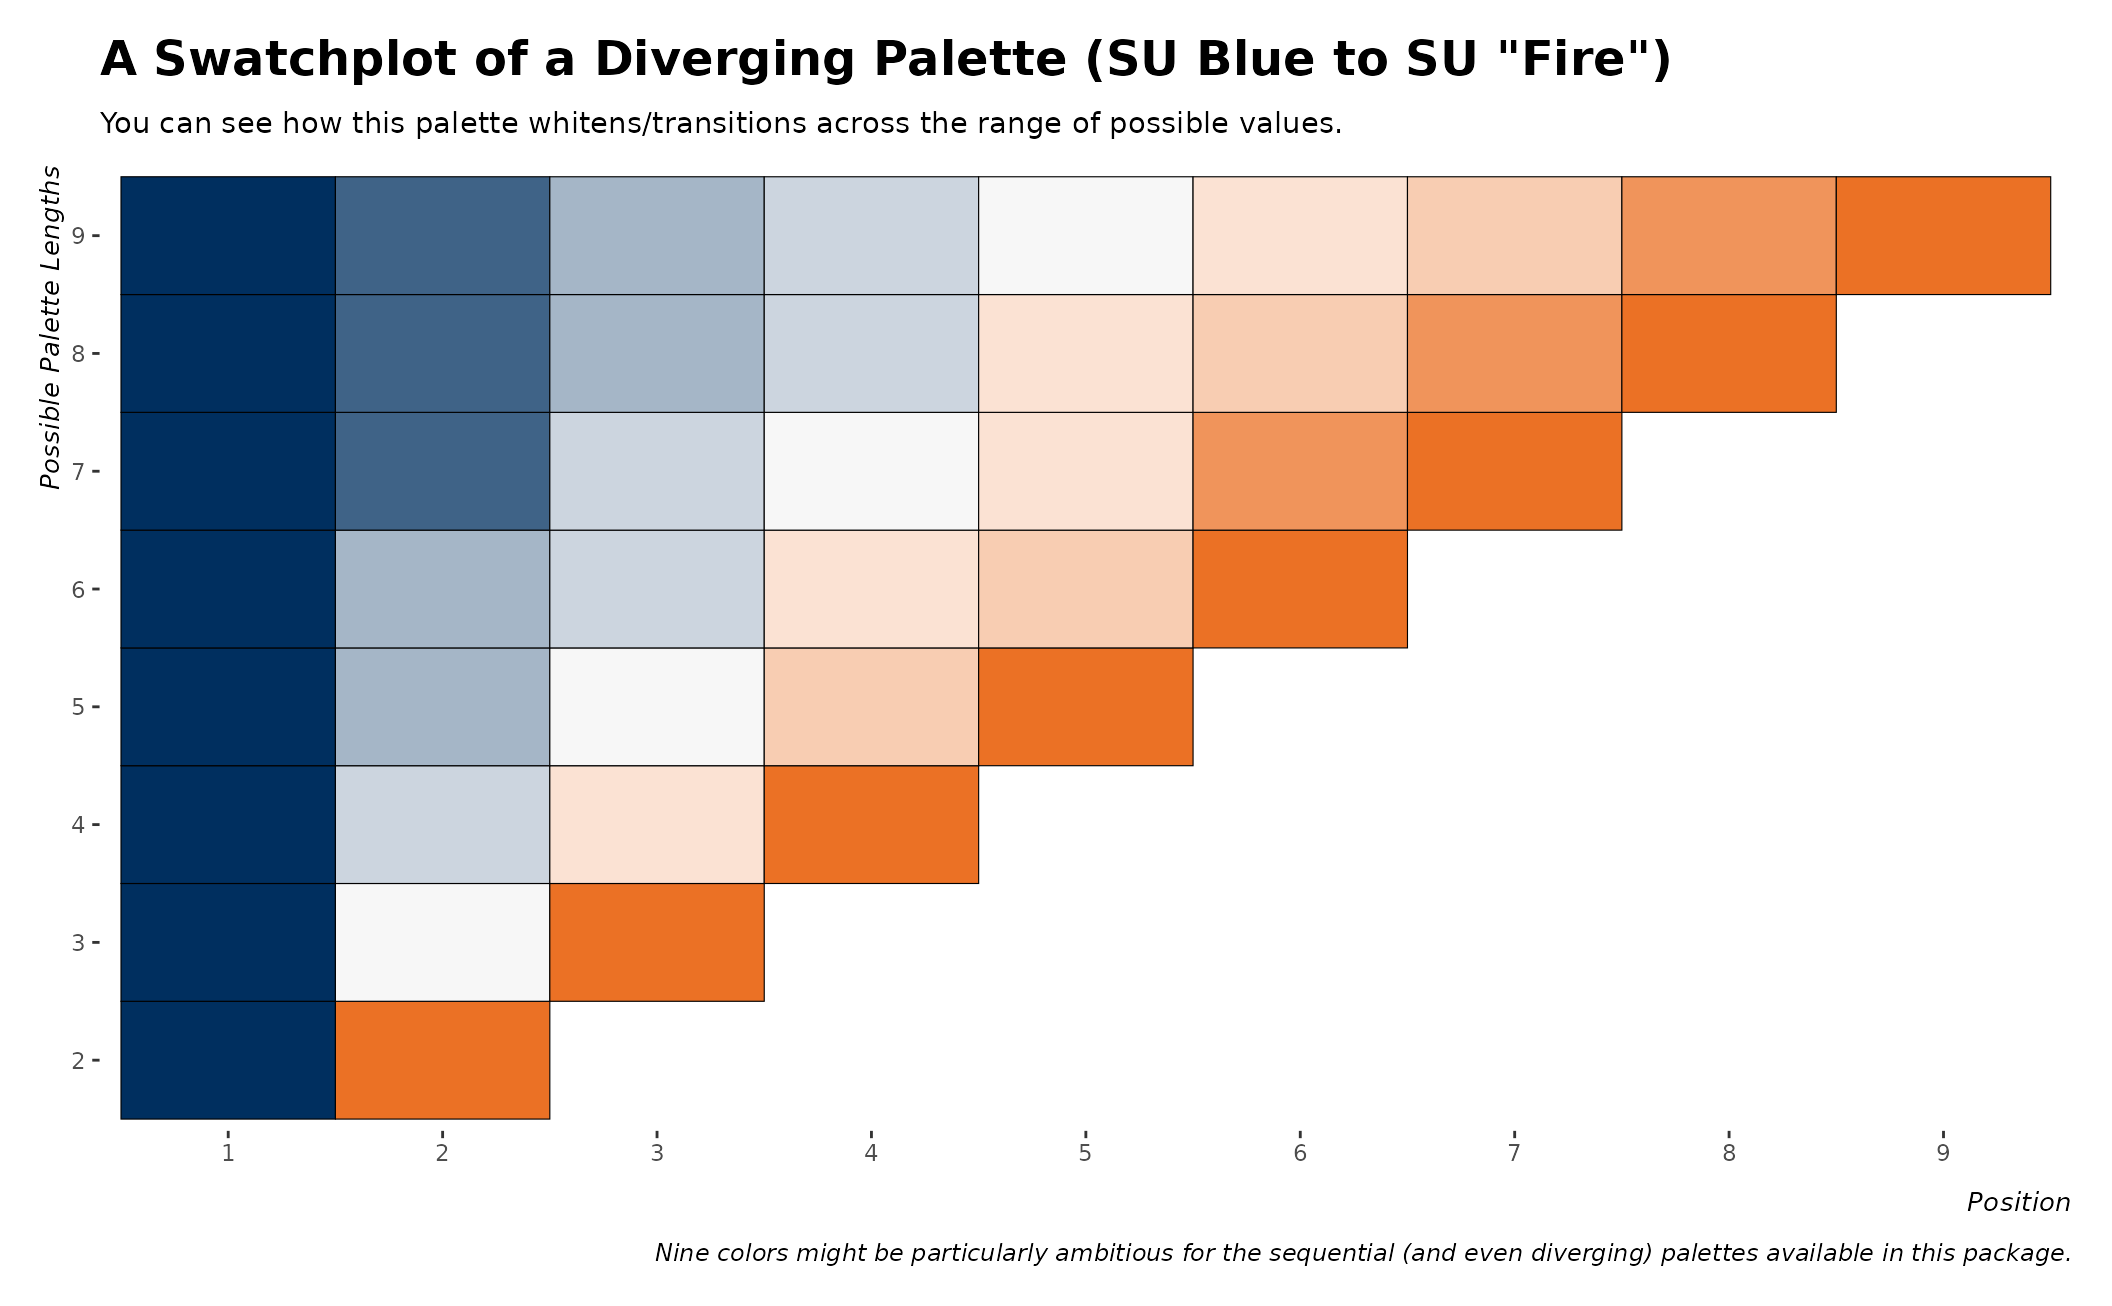
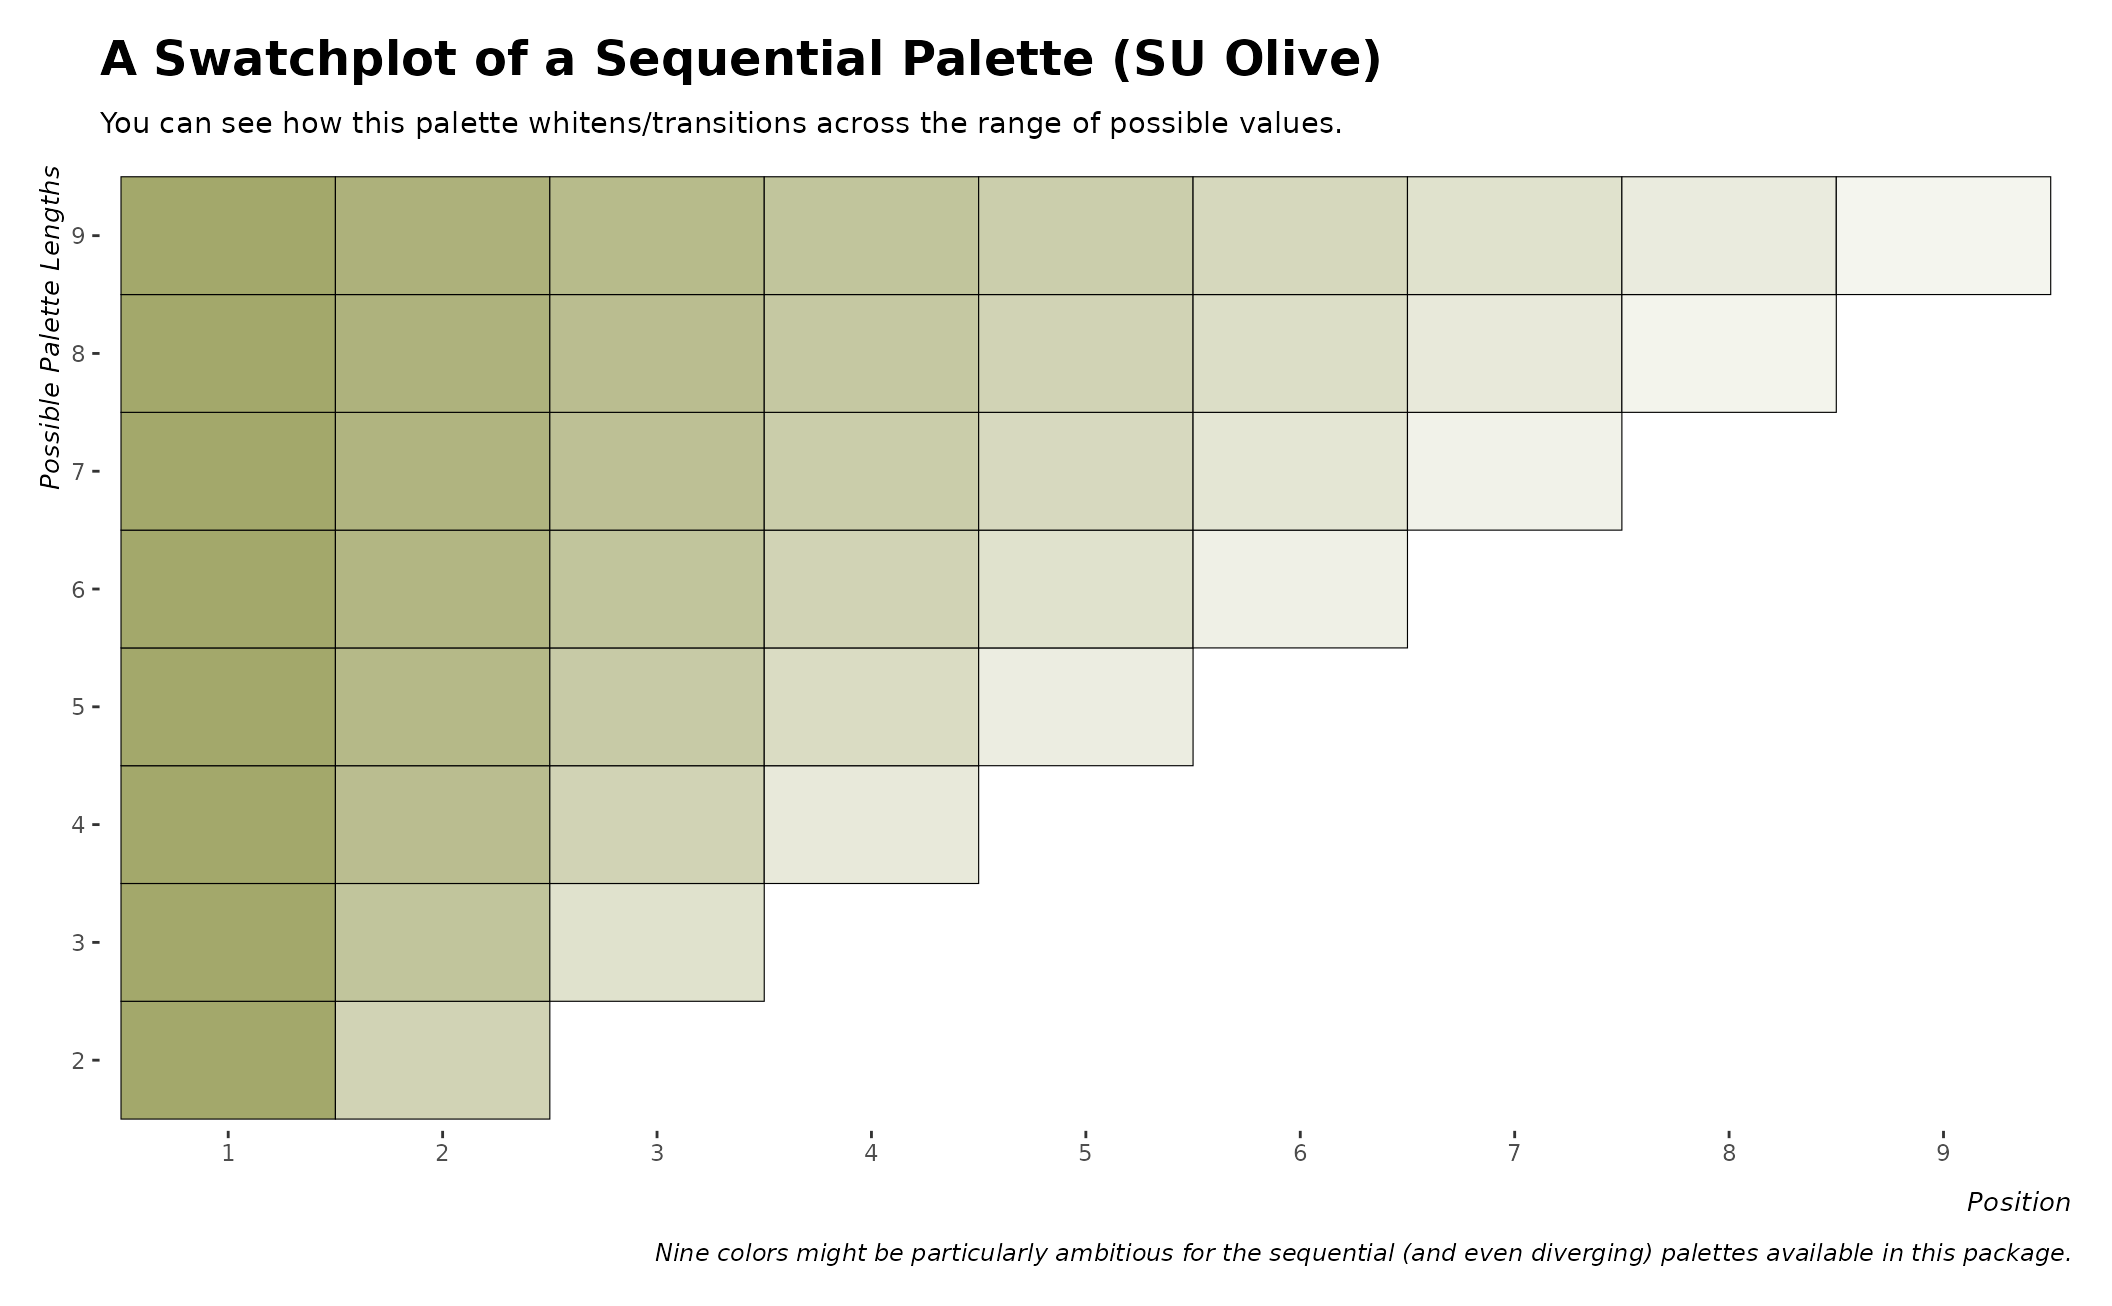
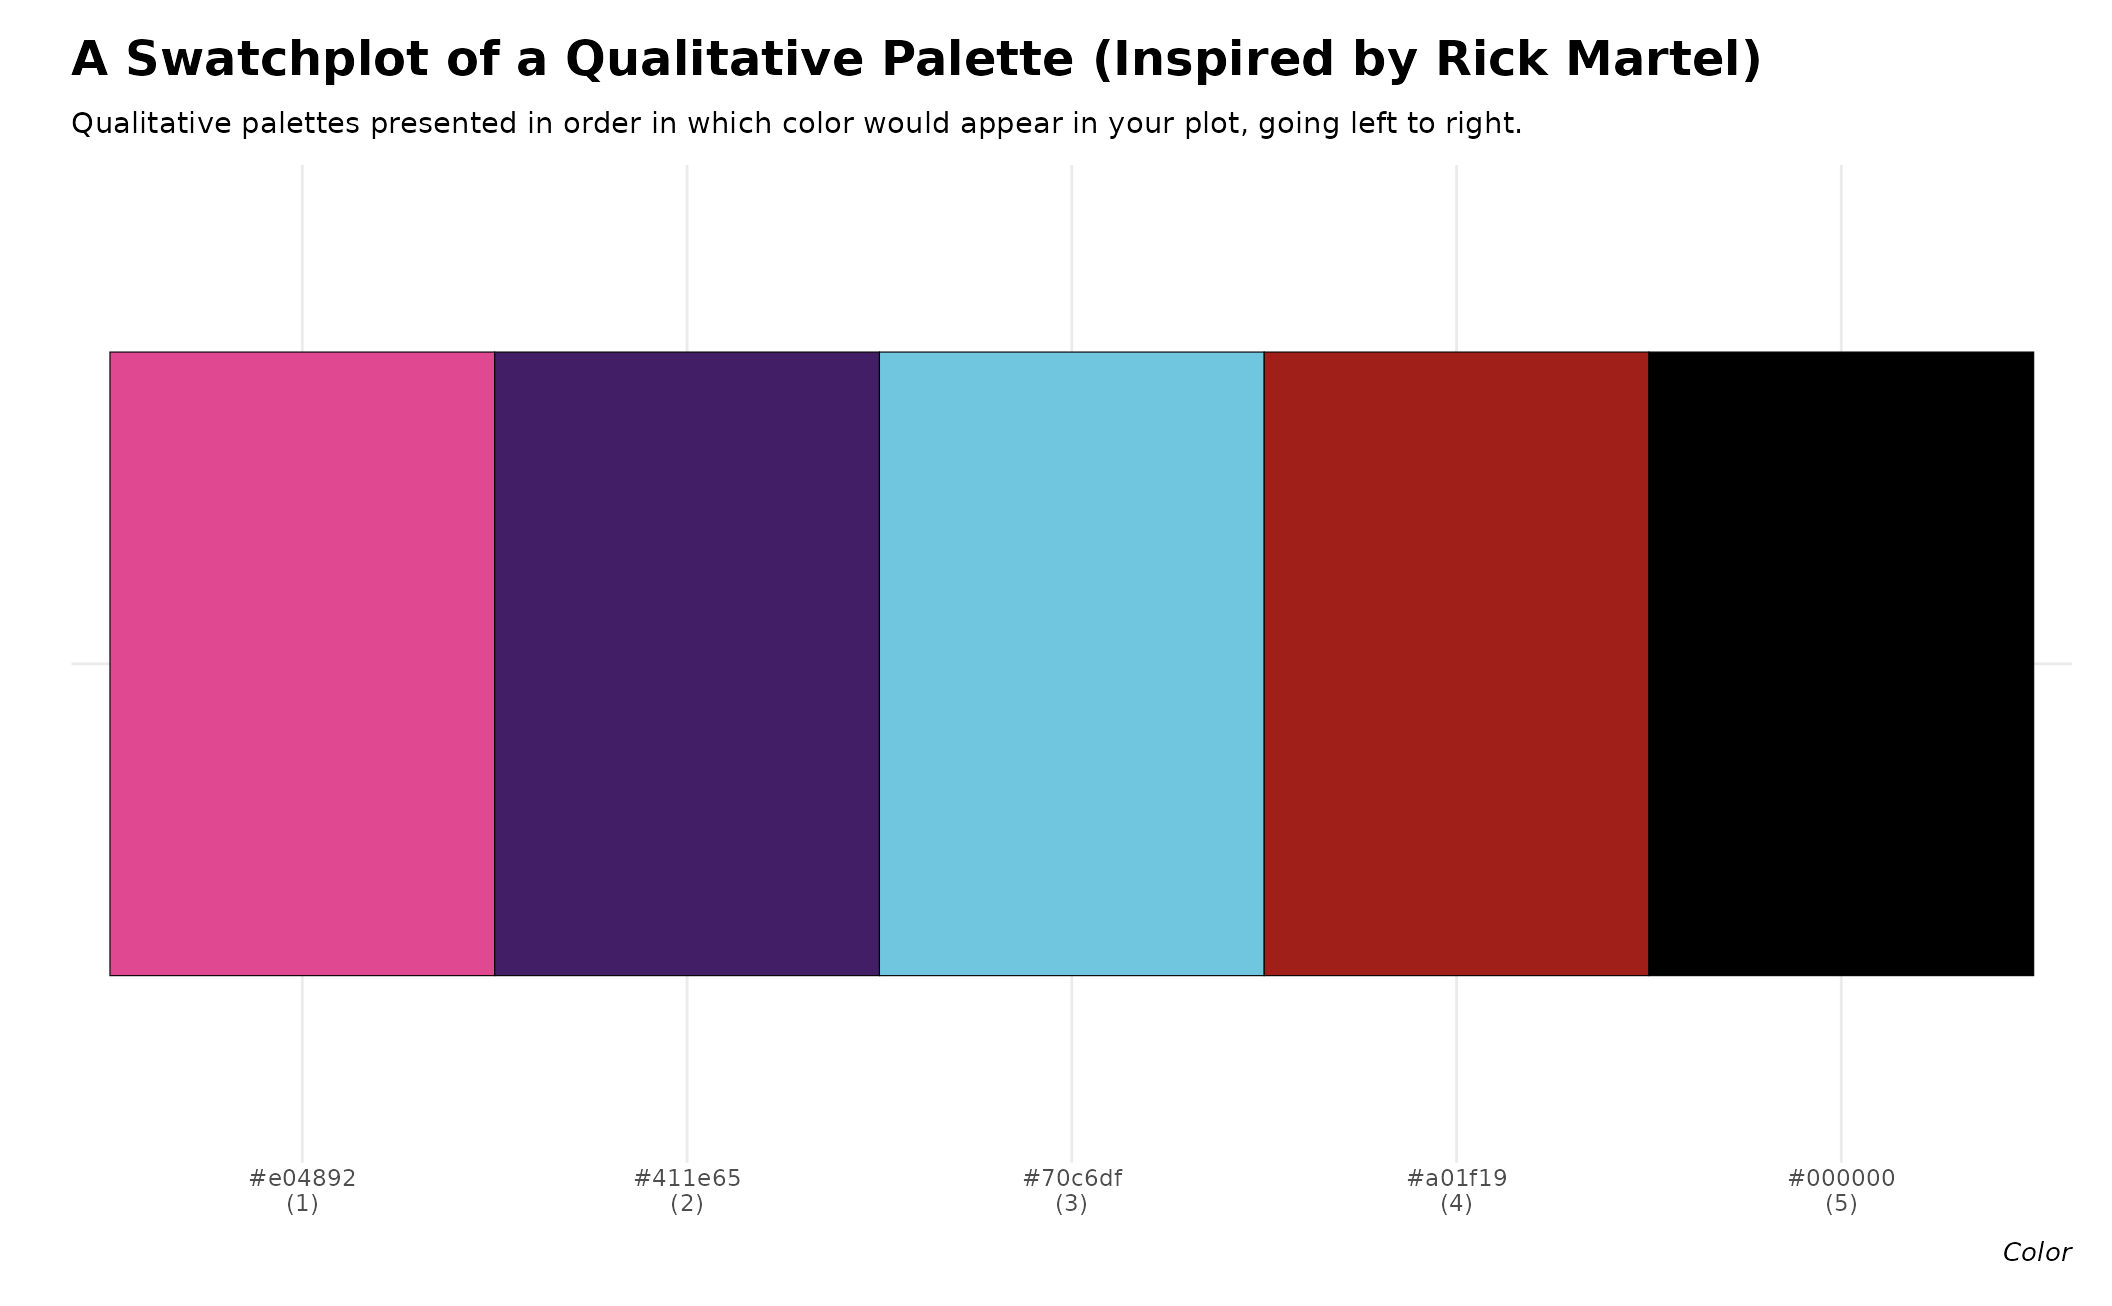
swatchplot() creates a plot of color swatches for the various palettes
included in this package.
Arguments
- palette
must be NULL or one of the palettes included in this package. If NULL (the default value), the swatchplot returns swatches for palettes.
- style
passed to
theme_steve()in the construction of the plot. Defaults to "generic" for testing purposes. Consult the documentation fortheme_steve()for more information.- font
defaults to NULL and used only when the
styleargument is "custom". Used for specifying the font of the user's choice that, one assumes, is available on their computer.- ...
called to make the shortcut of
splt()work.
Value
swatchplot() returns a plot of the colors available in a requested
palette, or all available palettes, as a ggplot2 object.
Details
The palette argument must be NULL or one of the palettes included in this
package and listed in the palettes data frame in this package. If the
palette requested is a diverging or sequential palette, the swatchplot returns
all colors in the palette for a length of 2 to 9 (the maximum). If the palette
requested is qualitative, the swatchplot is all colors in the palette and their
position in it.