Miscellaneous functions to make your ggplot2 plot "print-ready"
Source:R/print-ready.R
print-ready.RdThese are assorted functions that will make your plot "print-ready" by removing gridlines and giving hard-line axes to the plot. These are typically changes requested by publishes for the printing process.
Value
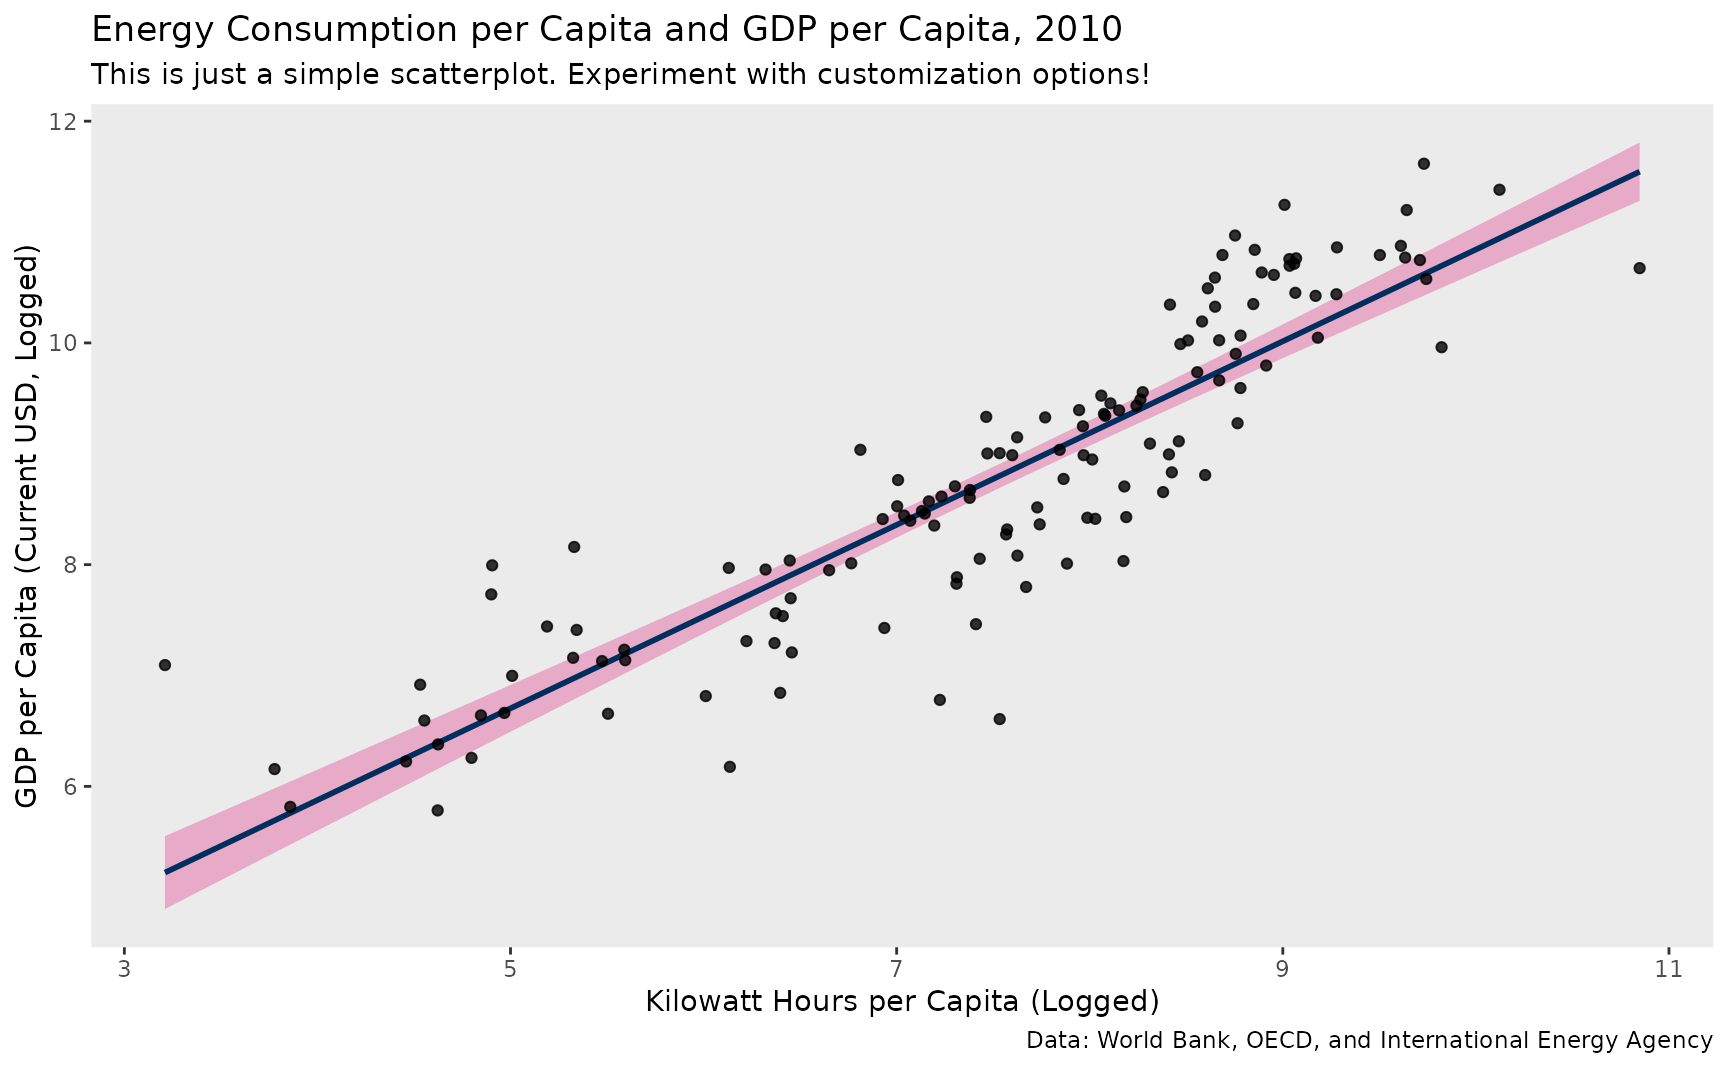
no_gridlines() takes a plot made in ggplot2 and removes
the gridlines from the plot before returning it to the user.
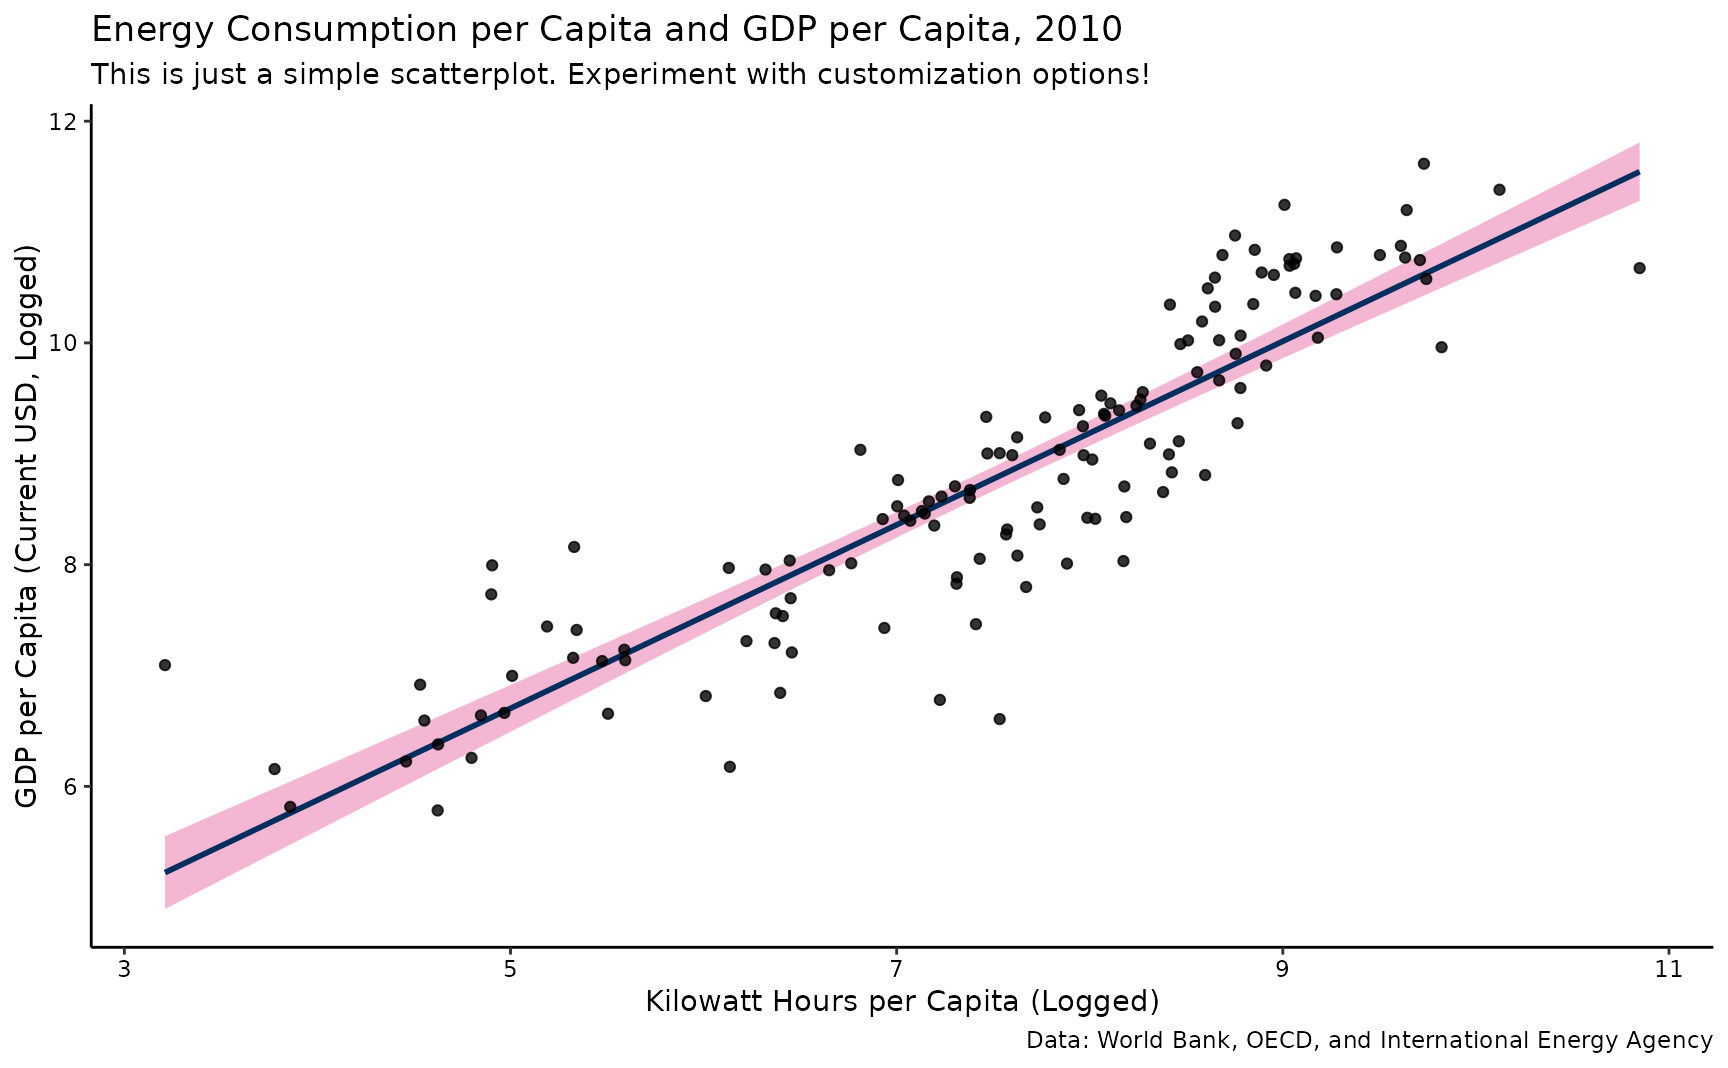
make_classic() takes a plot made in ggplot2 and removes the
gridlines, gray background, and adds solid axes to the plot.
Details
no_gridlines() is a simple wrapper for some basic
ggplot2 code that will allow you to remove gridlines from the plot.
make_classic() removes gridlines, removes the default gray background,
*and* imposes a black, solid line on both axes. It will also hard code the
axis text to be black. Using the latter with the former is likely redundant.
You will want to put these functions after a theme you've declared. If you run this before adding a theme over it, the theme you add will probably overwrite this function.
Examples
library(ggplot2)
example_plot(type = "scatter")
#> `geom_smooth()` using formula = 'y ~ x'
 example_plot(type='scatter') + no_gridlines()
#> `geom_smooth()` using formula = 'y ~ x'
example_plot(type='scatter') + no_gridlines()
#> `geom_smooth()` using formula = 'y ~ x'
 example_plot(type='scatter') + make_classic()
#> `geom_smooth()` using formula = 'y ~ x'
example_plot(type='scatter') + make_classic()
#> `geom_smooth()` using formula = 'y ~ x'