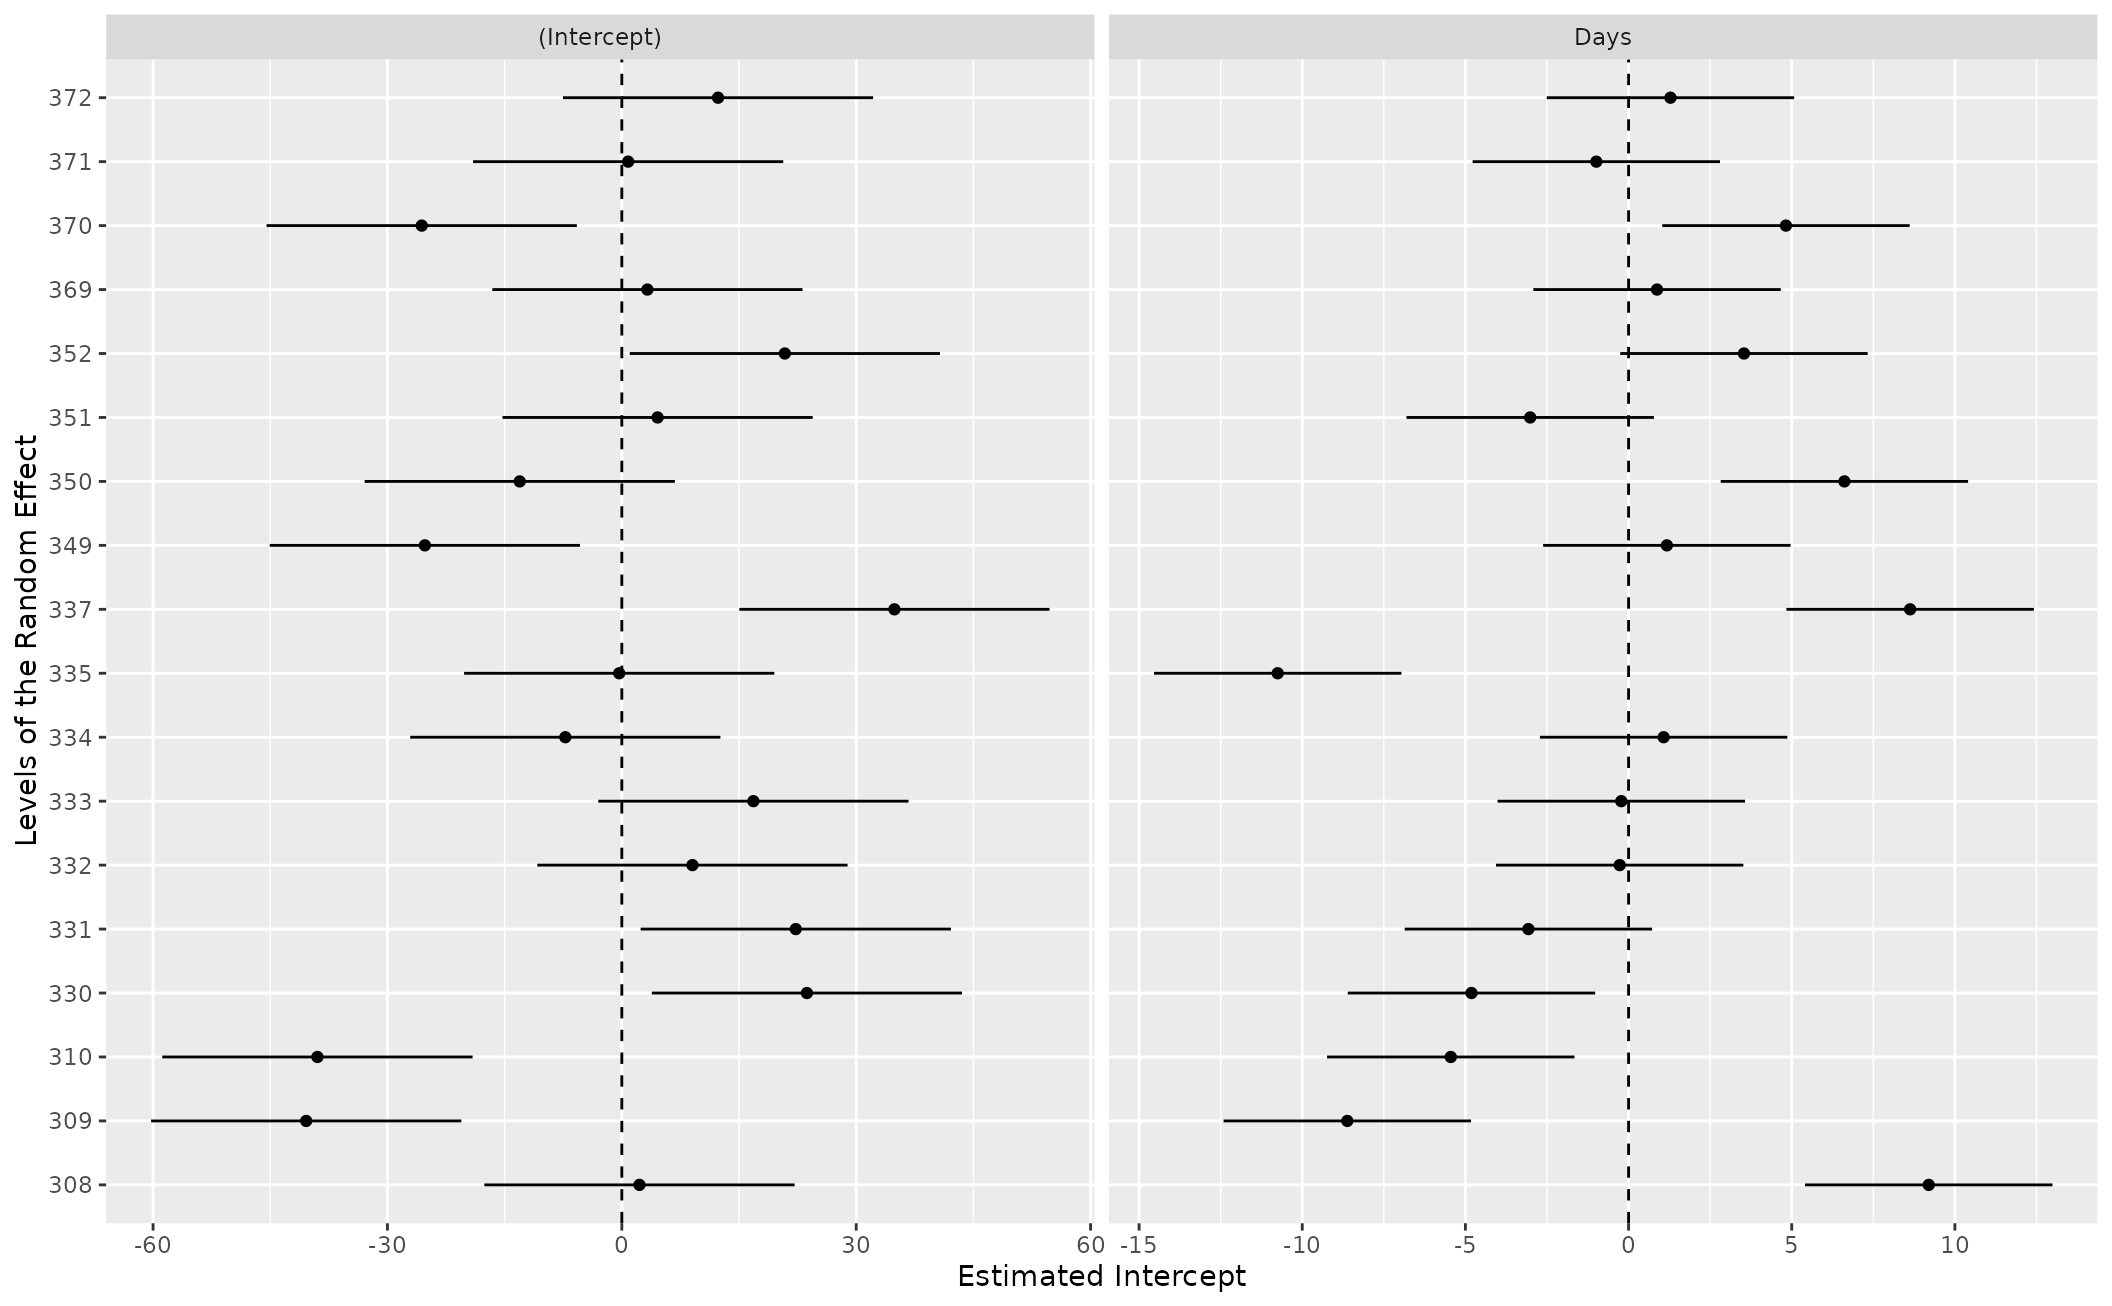
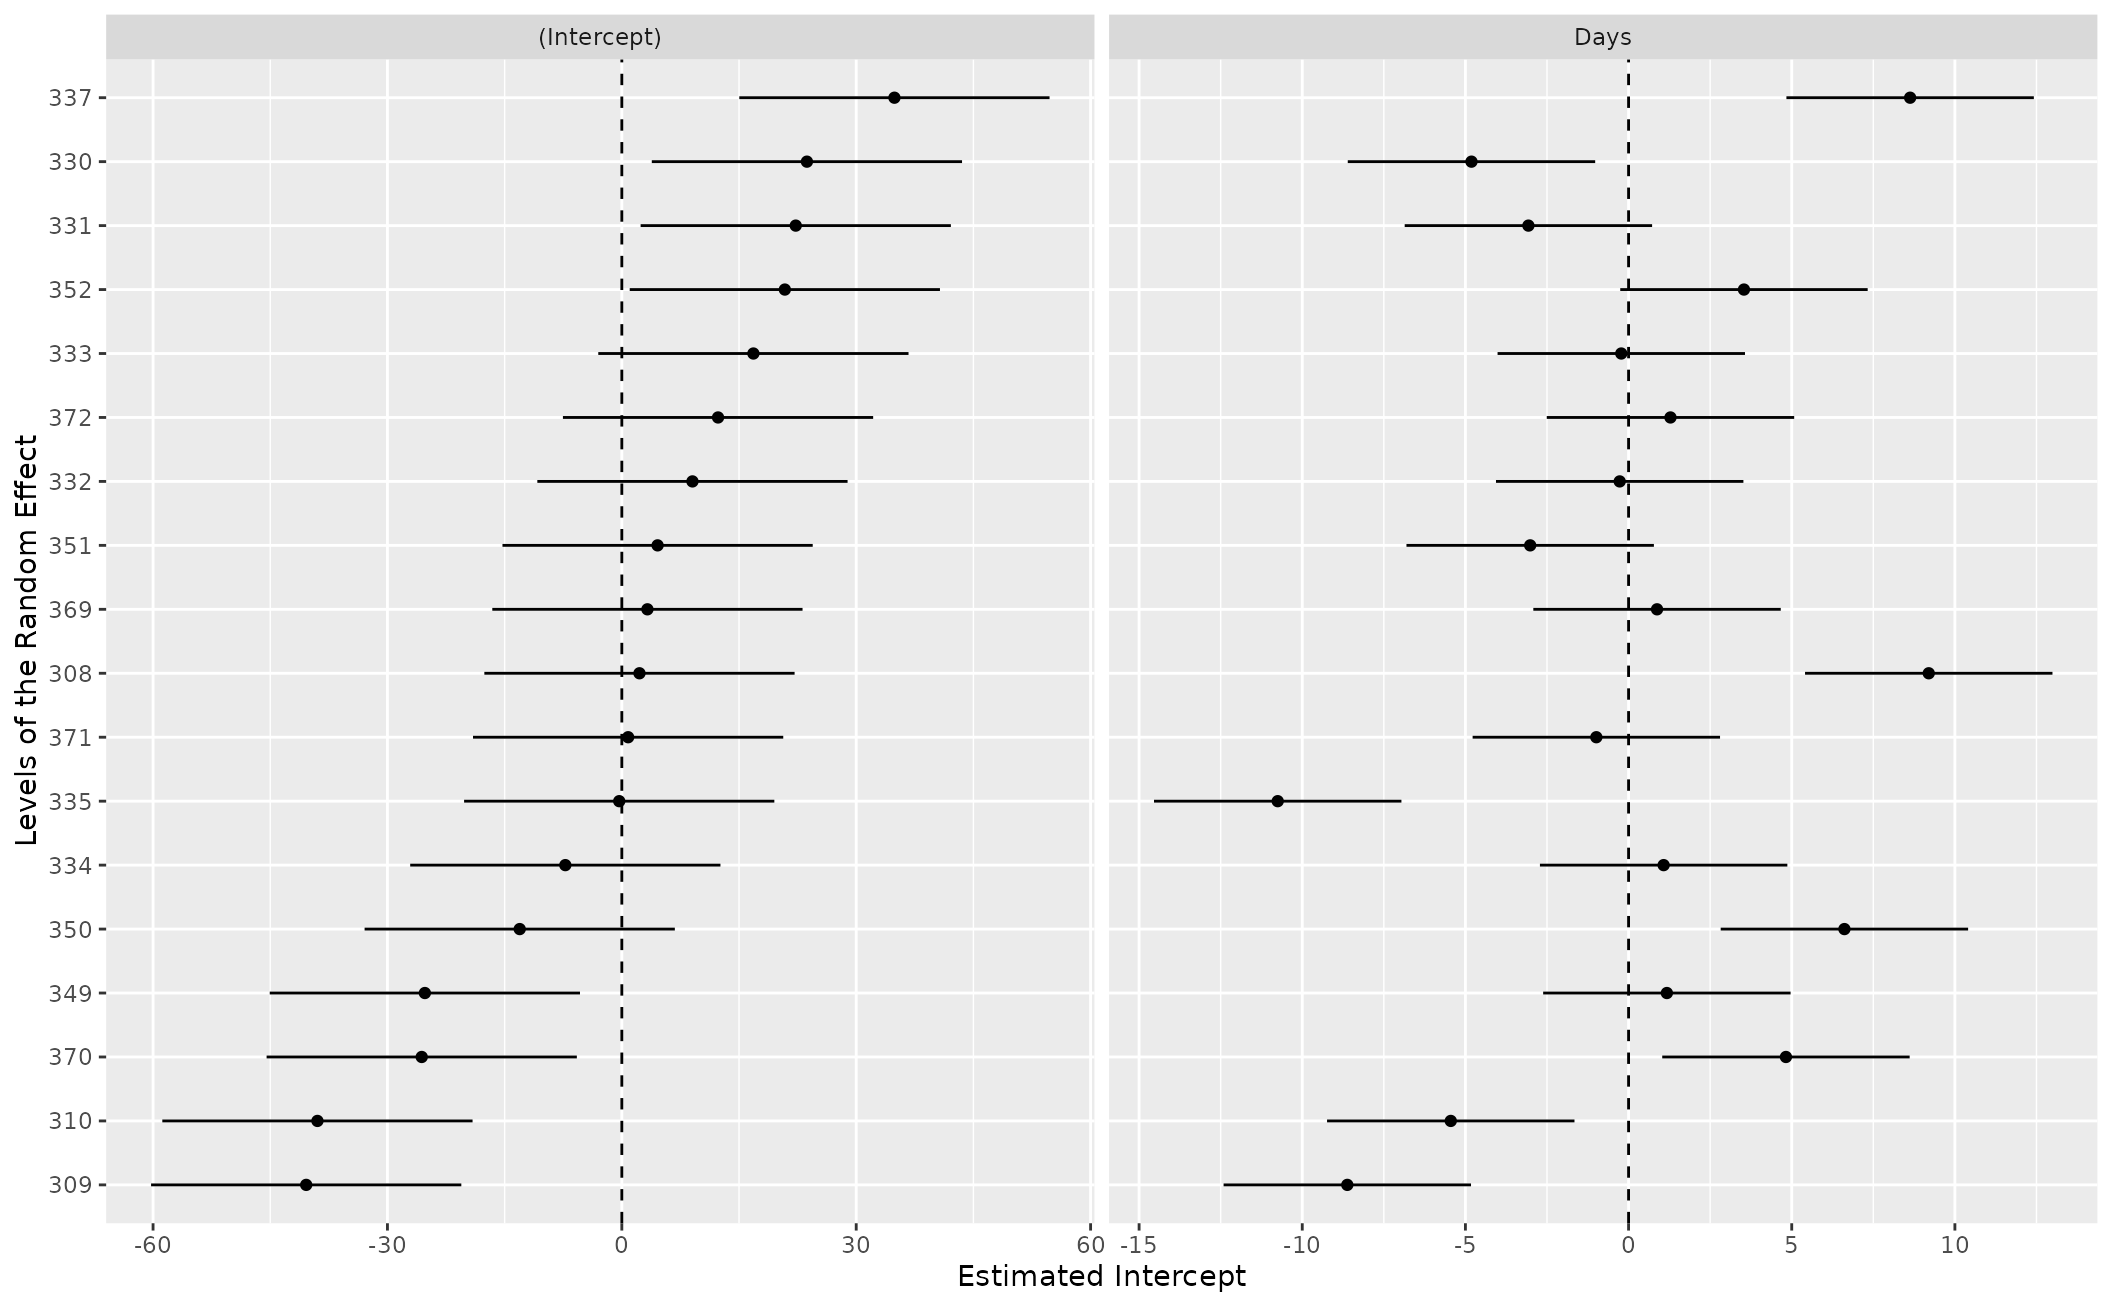
show_ranef() allows a user estimating a mixed model to quickly
plot the random intercepts (with conditional variances) of a given random effect
in a mixed model. In cases where there is a random slope over the intercept, the function
plots the random slope as another caterpillar plot (as another facet)
Arguments
- model
a fitted mixed model with random intercepts
- group
What random intercept/slopes do you want to see as a caterpillar plot? Declare it as a character
- reorder
optional argument. DEFAULT is TRUE, which “re-orders” the intercepts by the original value in the data. If FALSE, the ensuing caterpillar plot defaults to a default method of ordering the levels of the random effect by their estimated conditional mode.
Value
show_ranef() returns a caterpillar plot of the random intercepts from a given
mixed model. If broom.mixed::augment() can process it, this function should work just fine.

